macのWi-Fiボタンが押せない cannot push a button of wifi on mac
1. 事の起こり
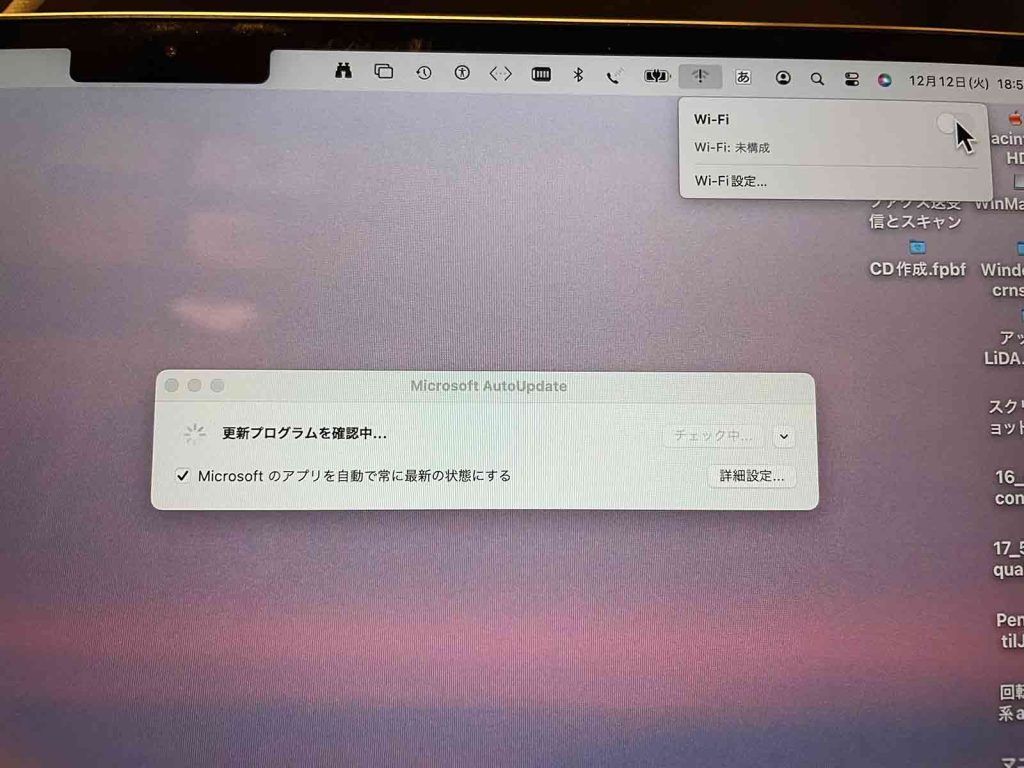
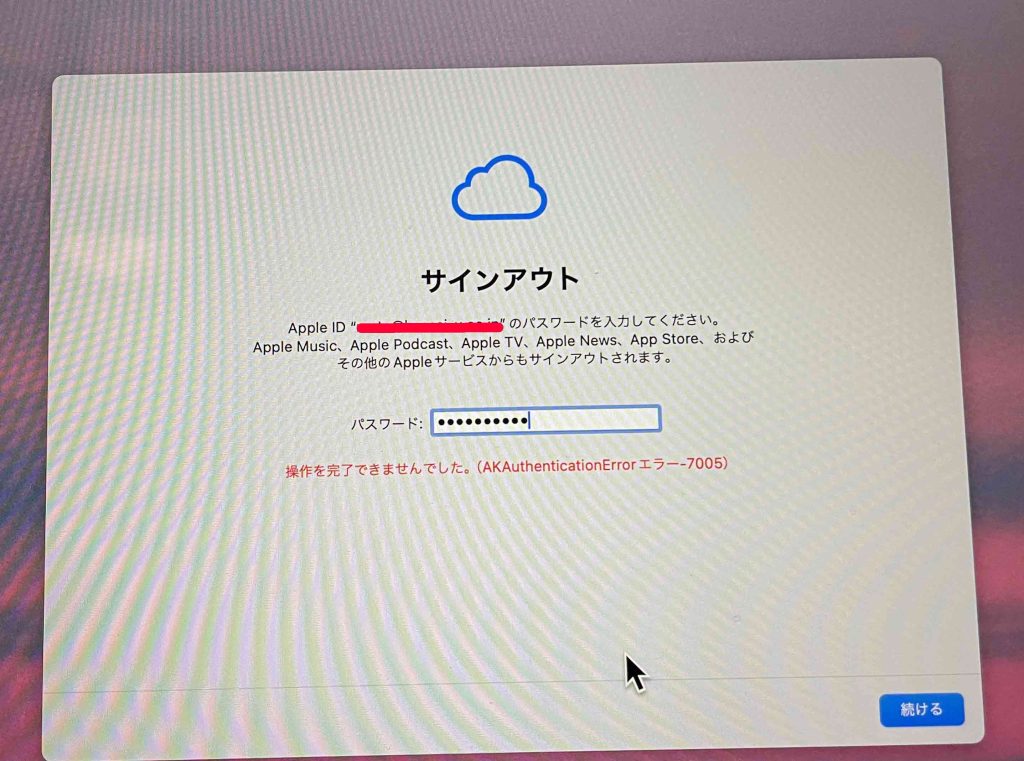
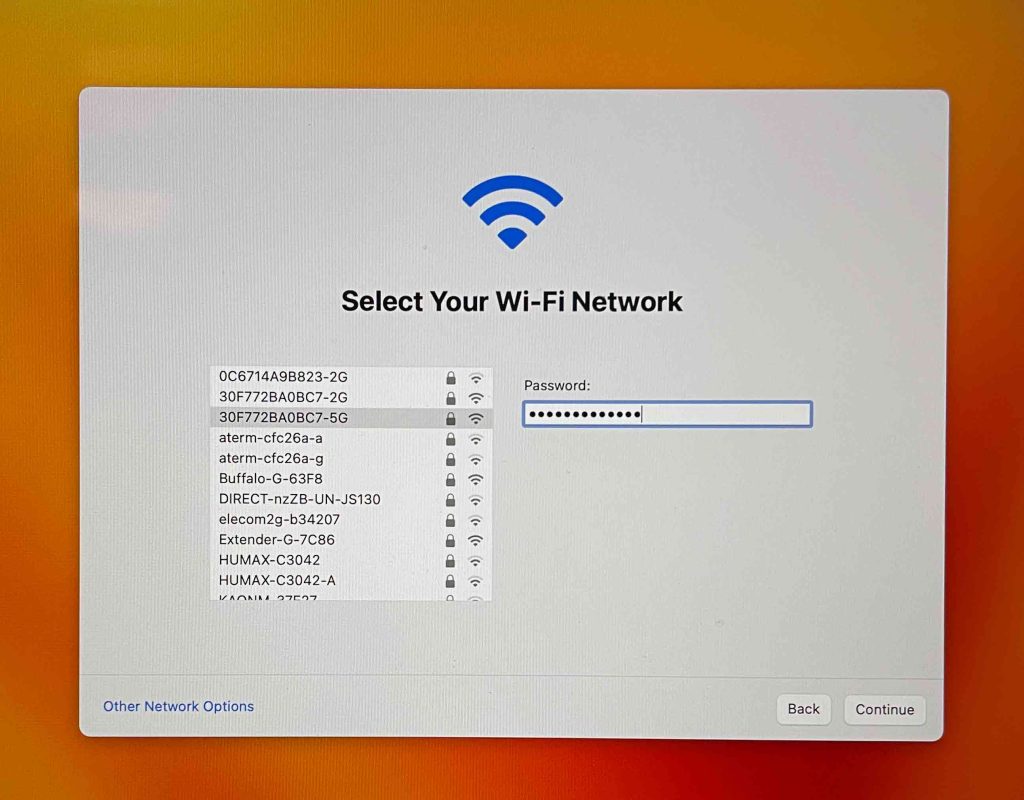
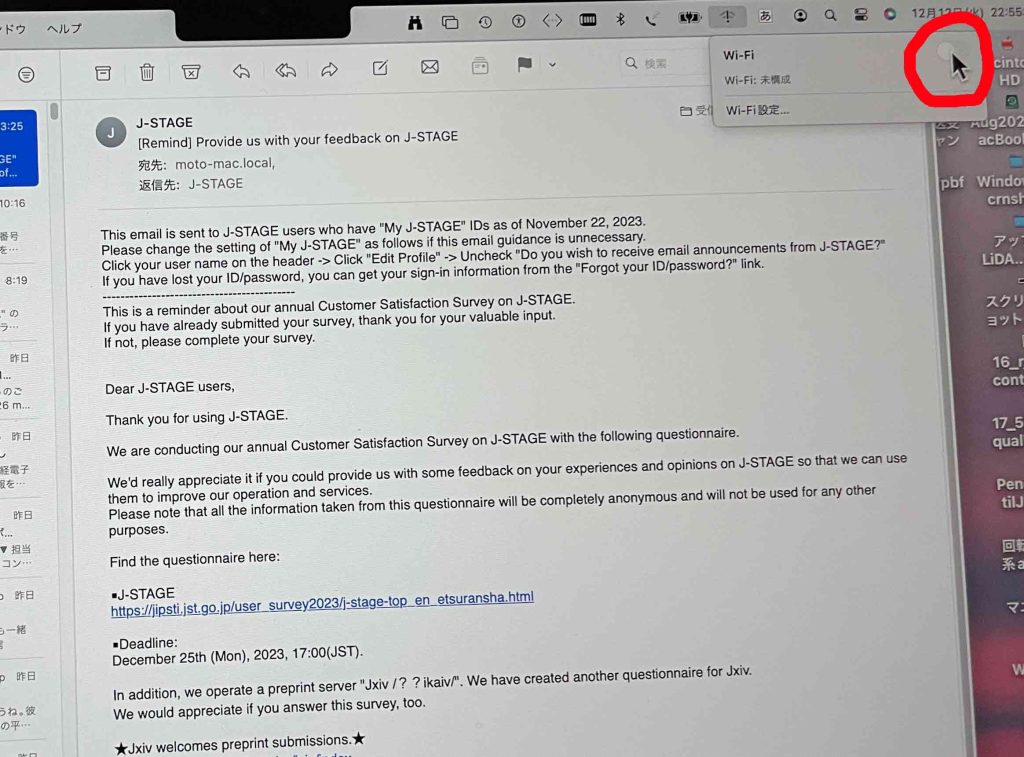
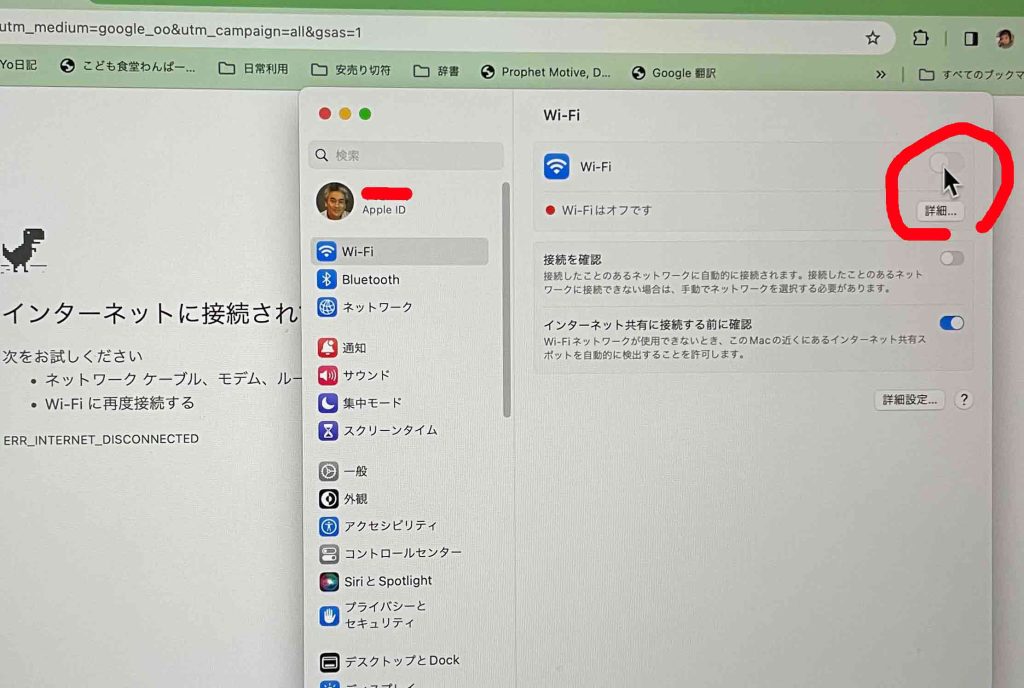
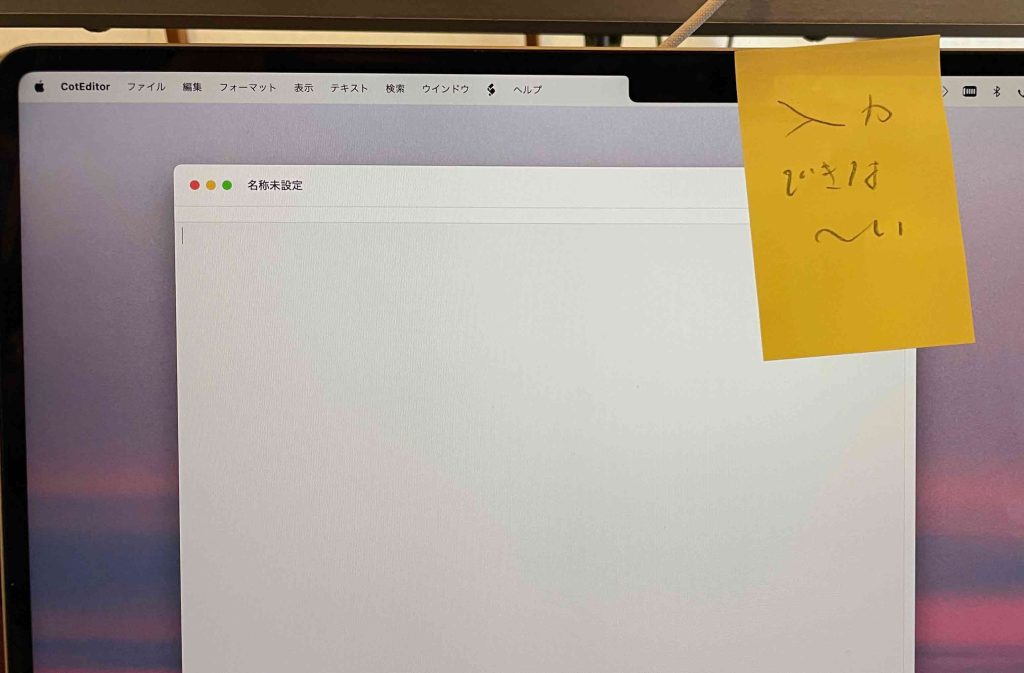
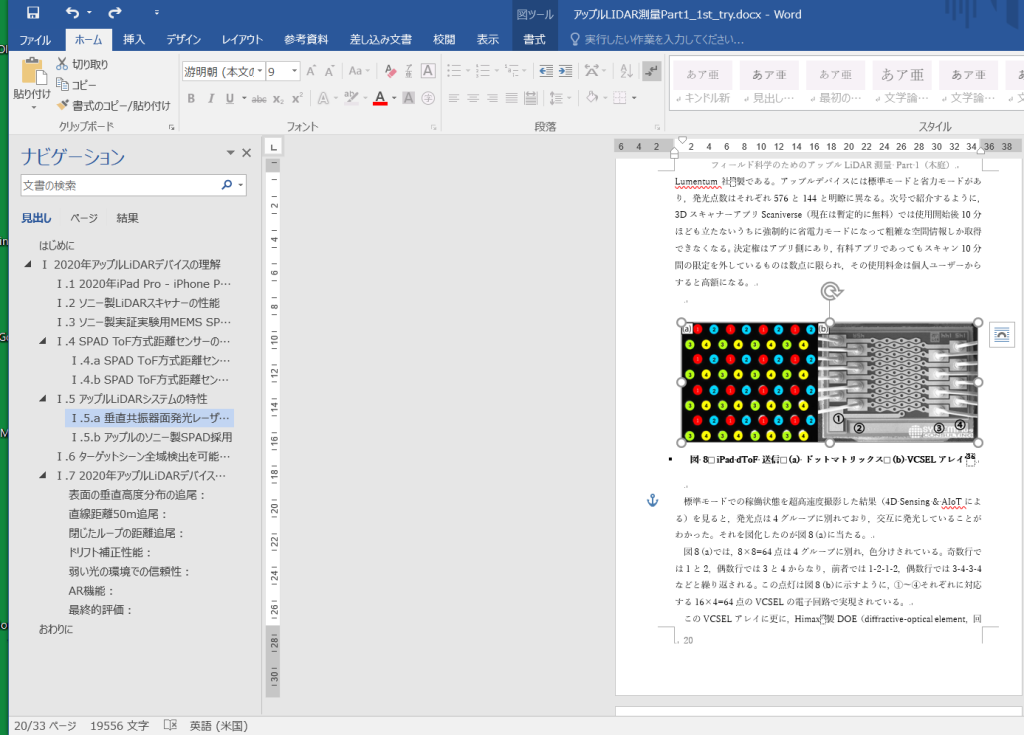
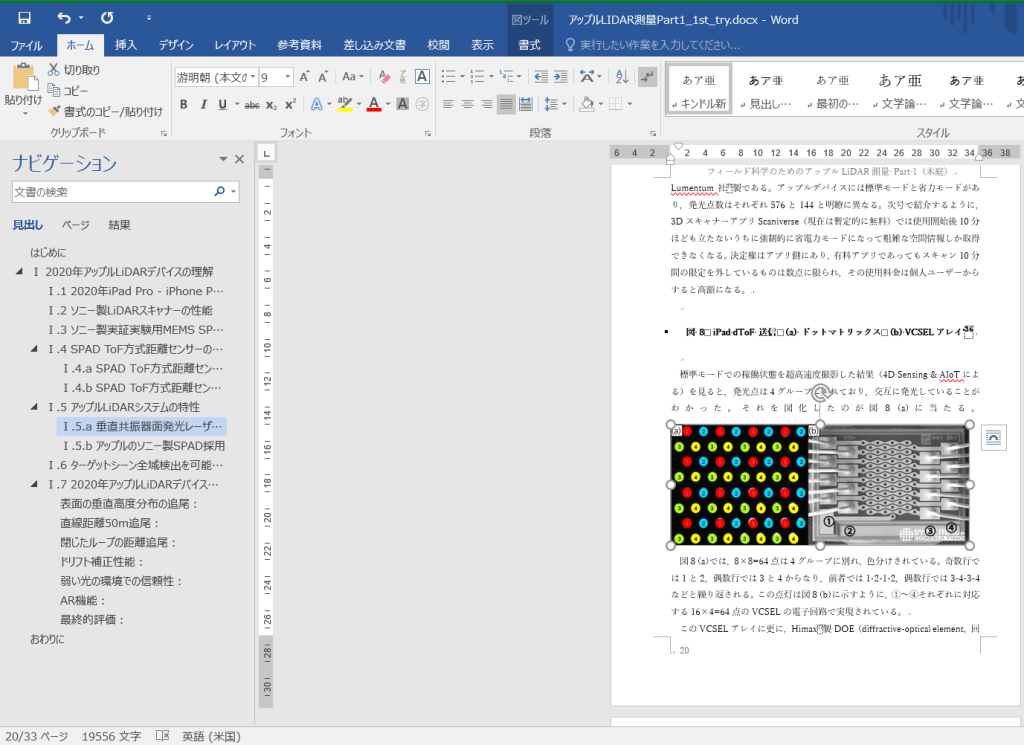
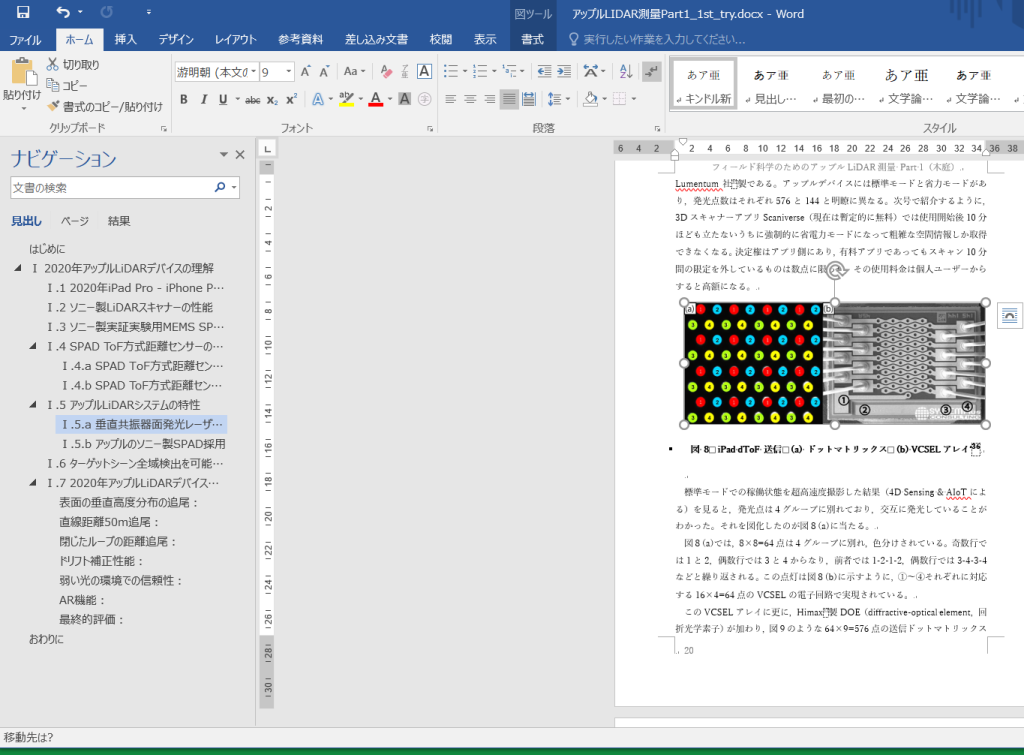
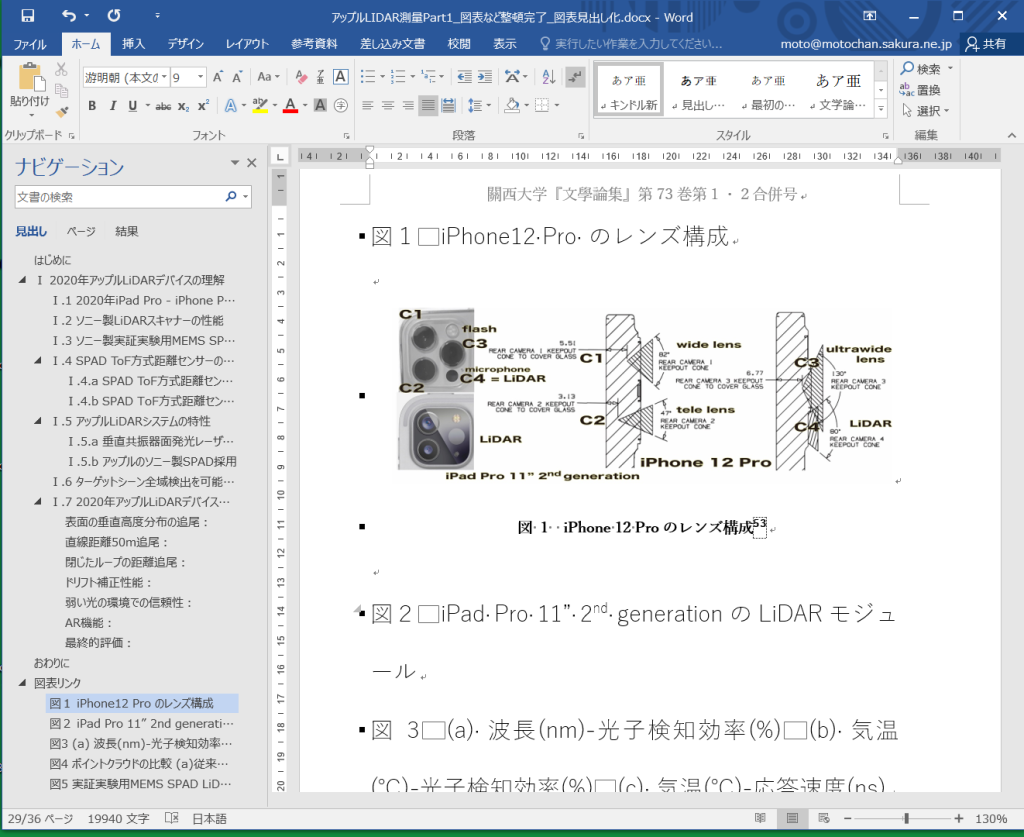
mac OS sierraでは,Windows 10とmacの間で,快適にファイル共有をしていた。月に1度ほどMacBook Pro(early 2014)がシュンと電源が落ちるので,愛用した専門的アプリが使えなくなることを承知?で,MacBook AIRに移行した。その後,それなりにファイル共有が使えたが,Sonoma内の最新のアップデートのあと,使用環境が気になって,ぼくのWebページを参考にしつつ,システム設定の,共有とネットワークを触っていた。とくに特別なことはしていない。が,気づいたら,自宅のWi-Fiが使えない。Windowsマシーンやアイフォーンでは問題がない。Wi-FiのボタンがOFFのままでさわれない。
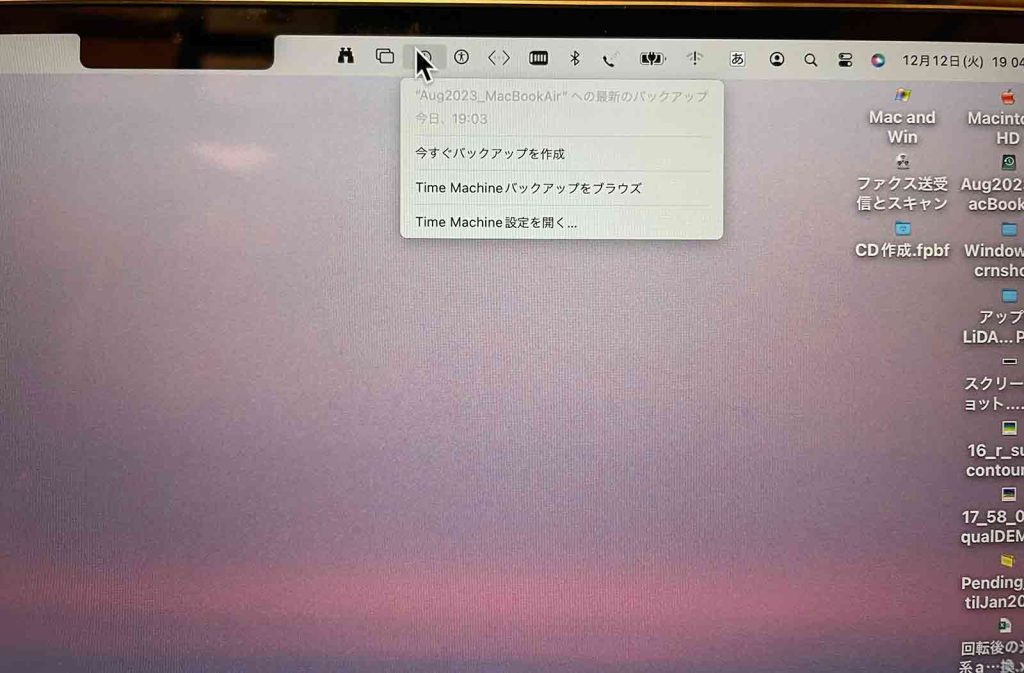
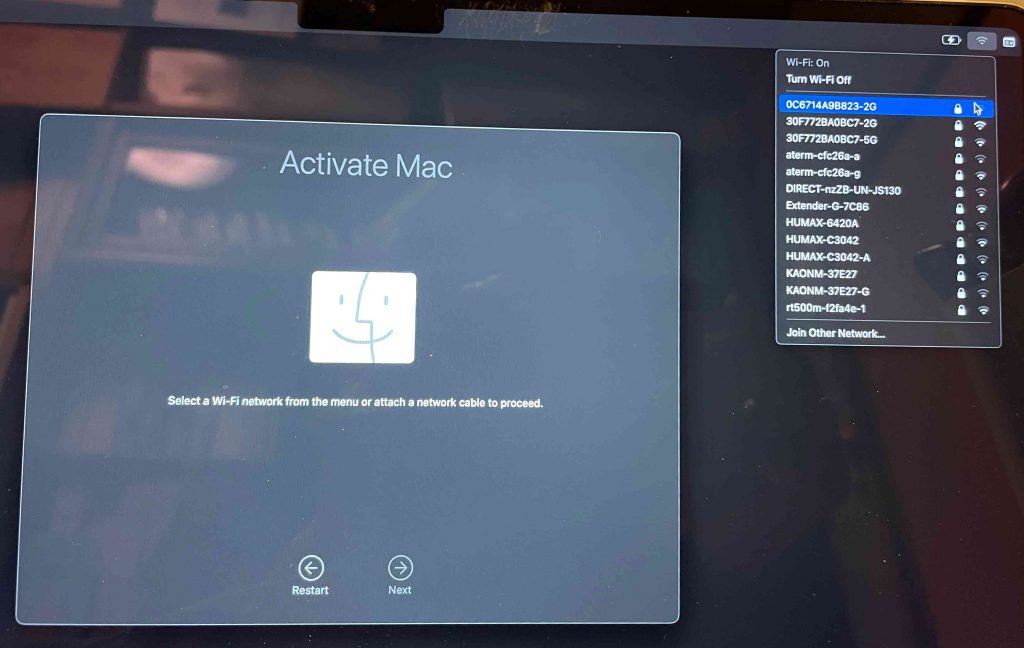
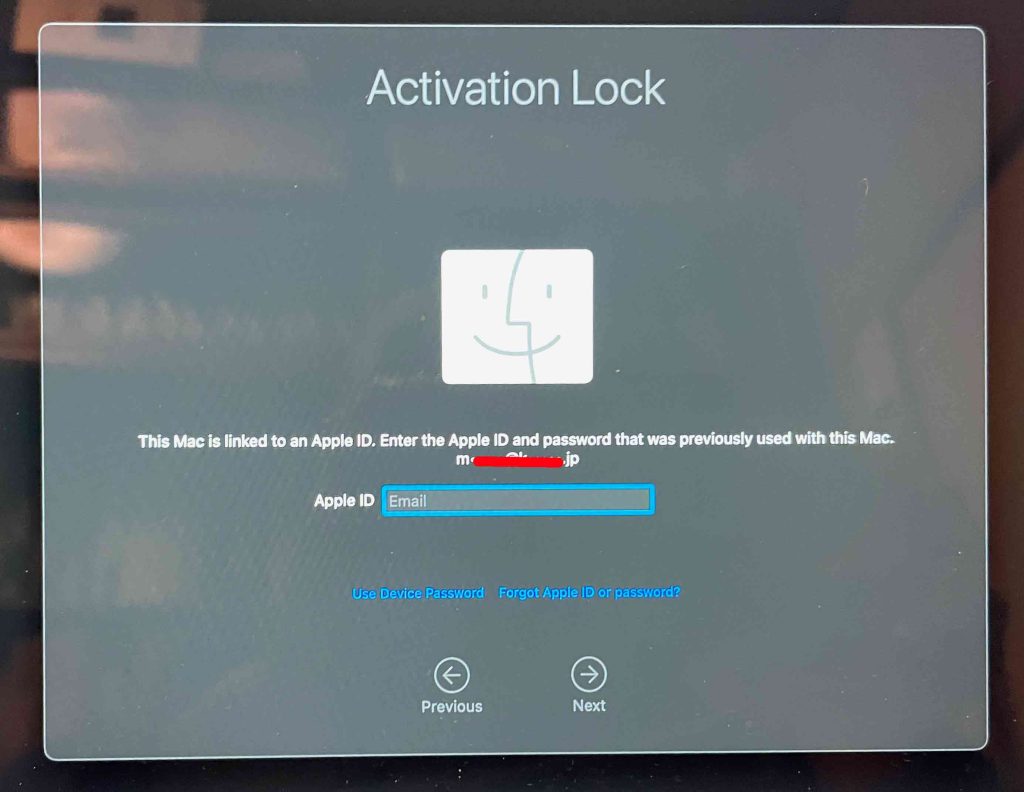
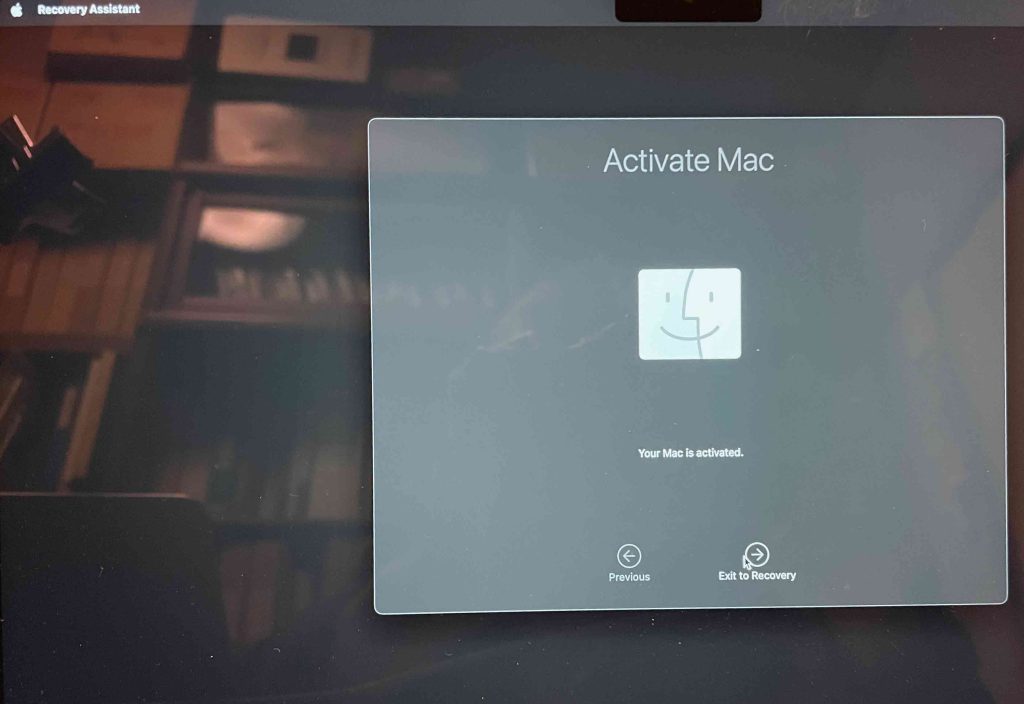
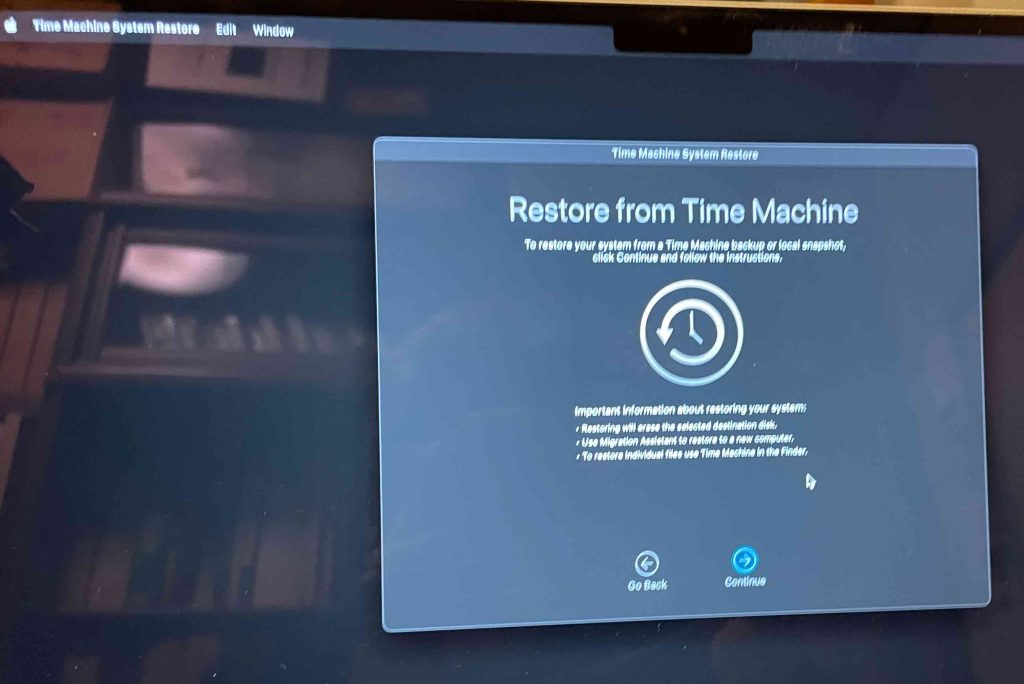
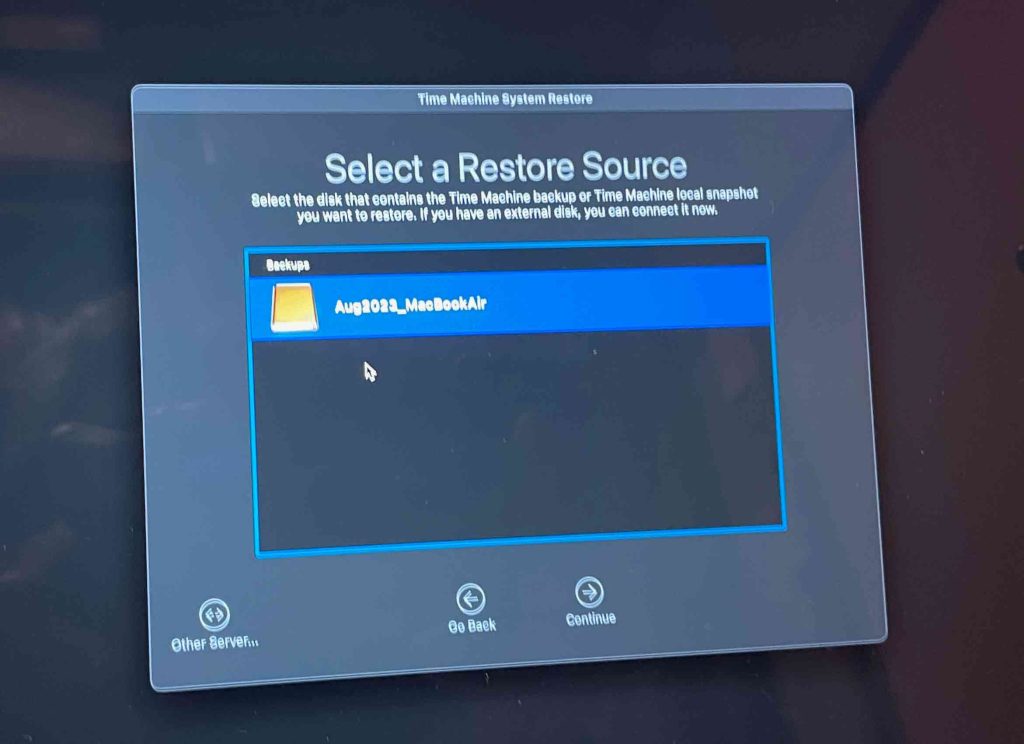
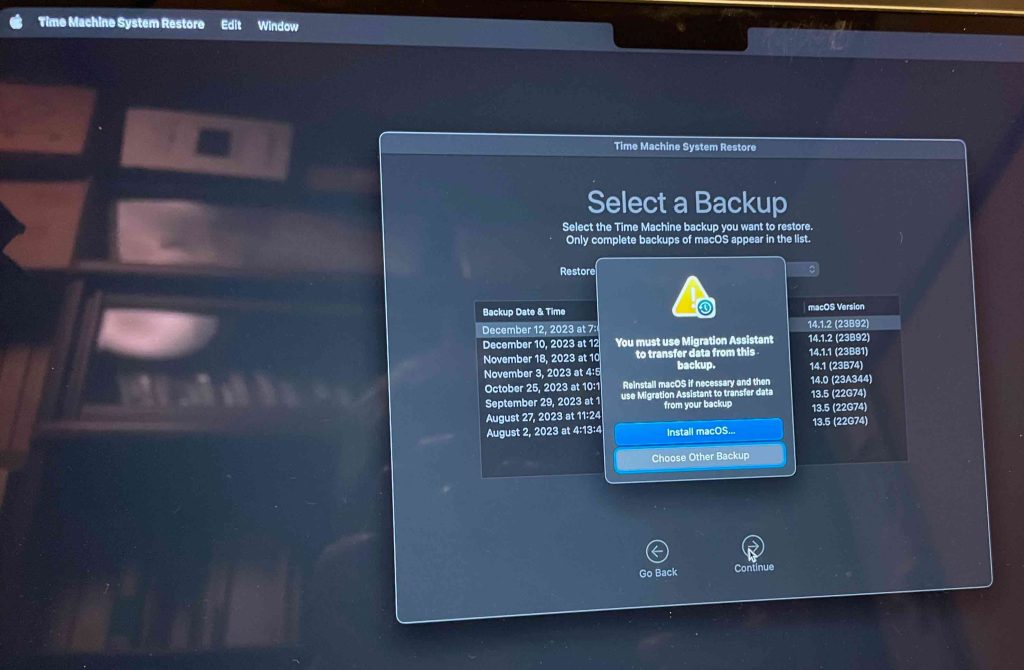
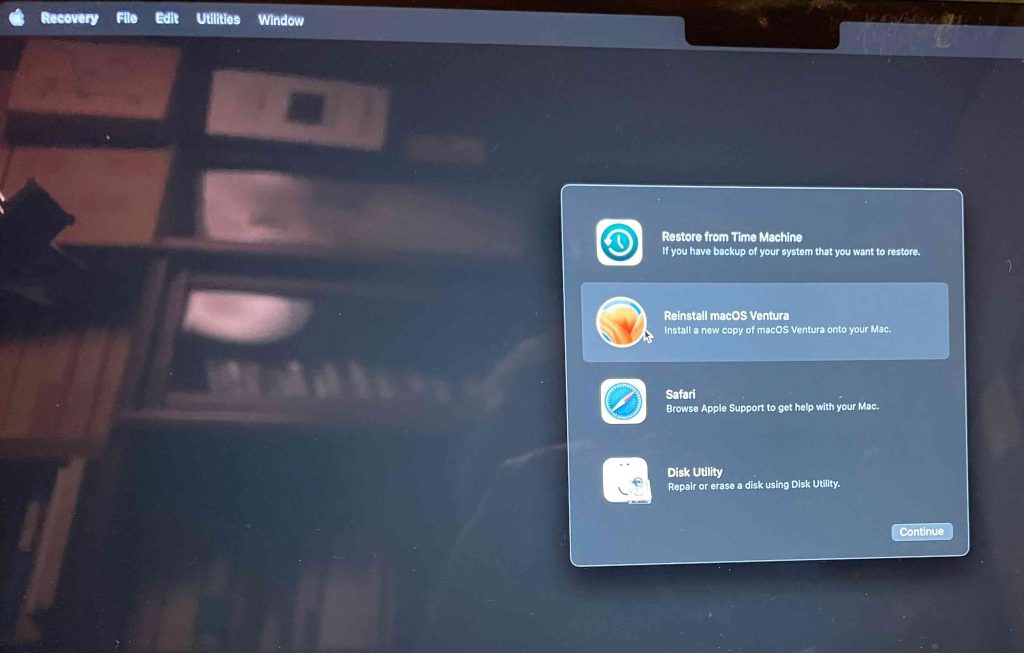
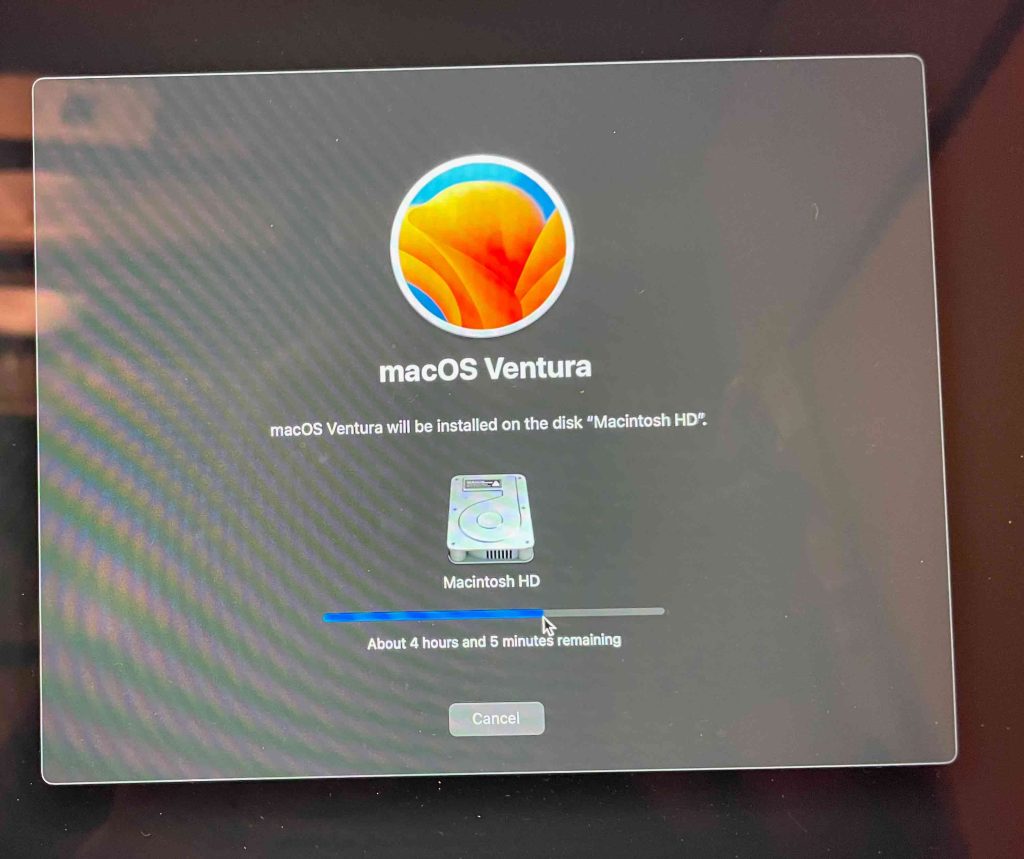
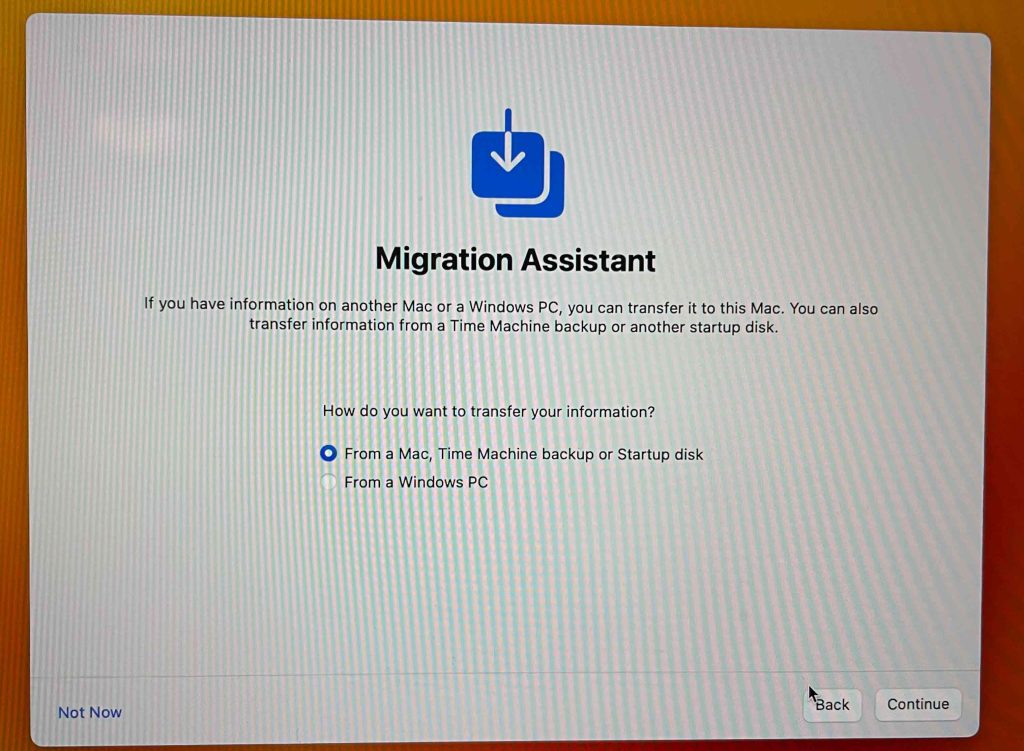
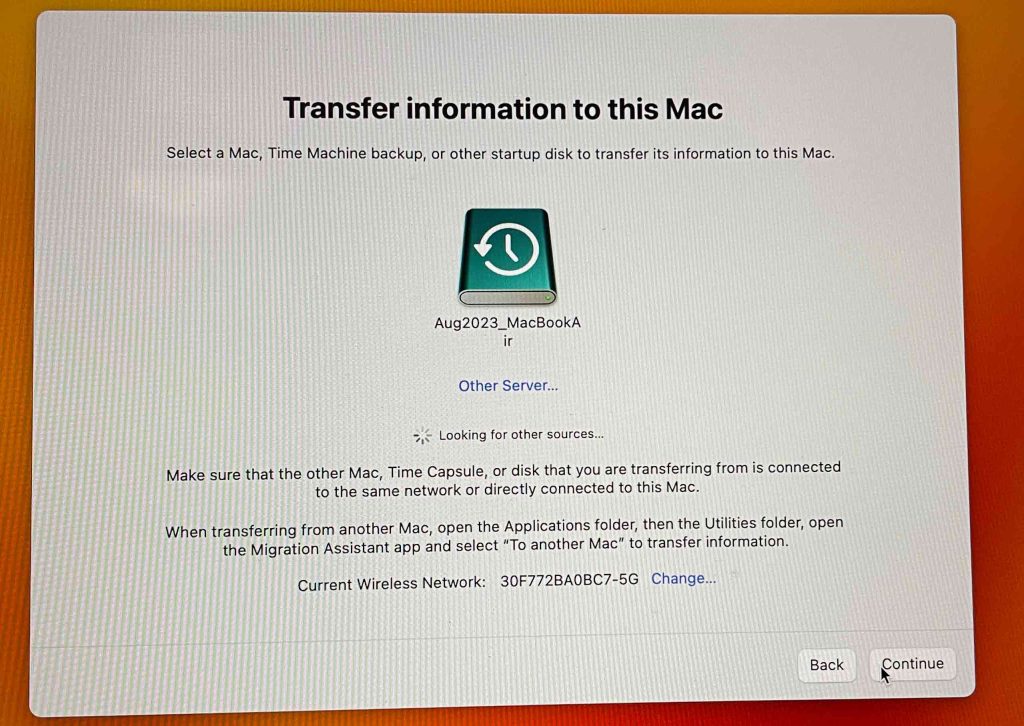
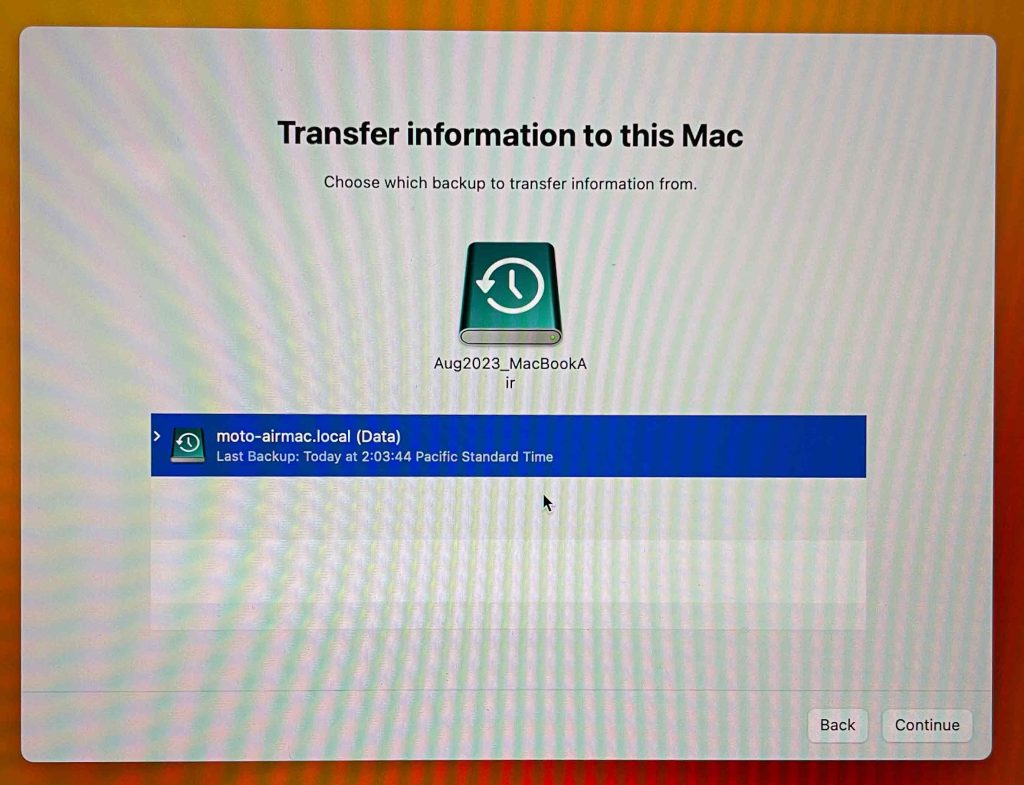
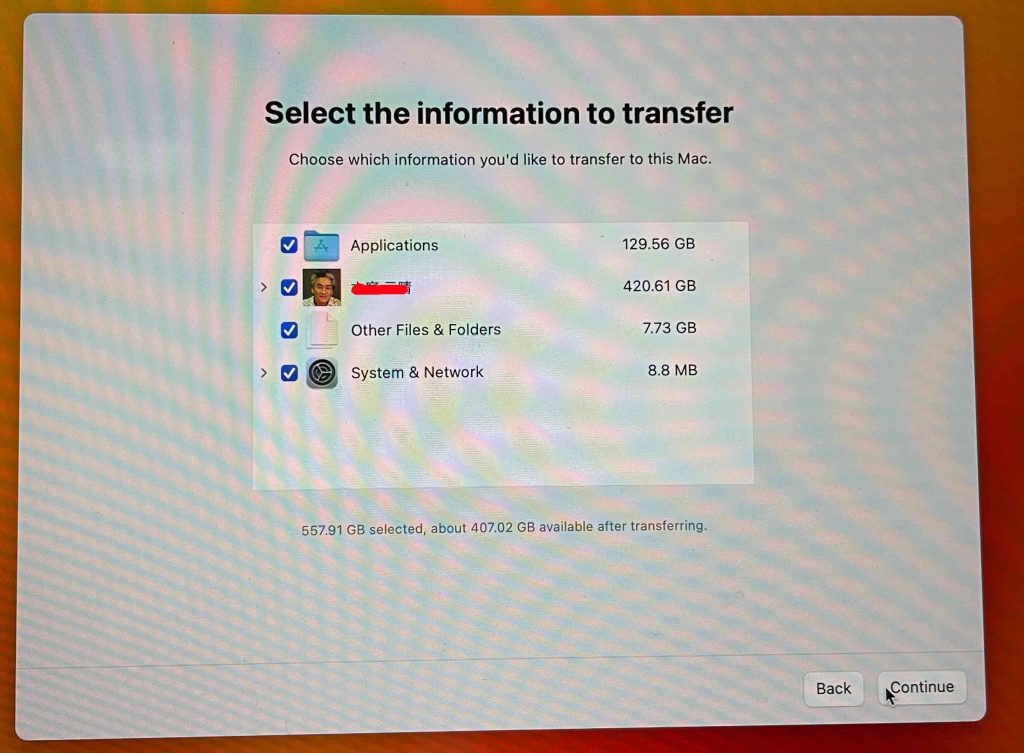
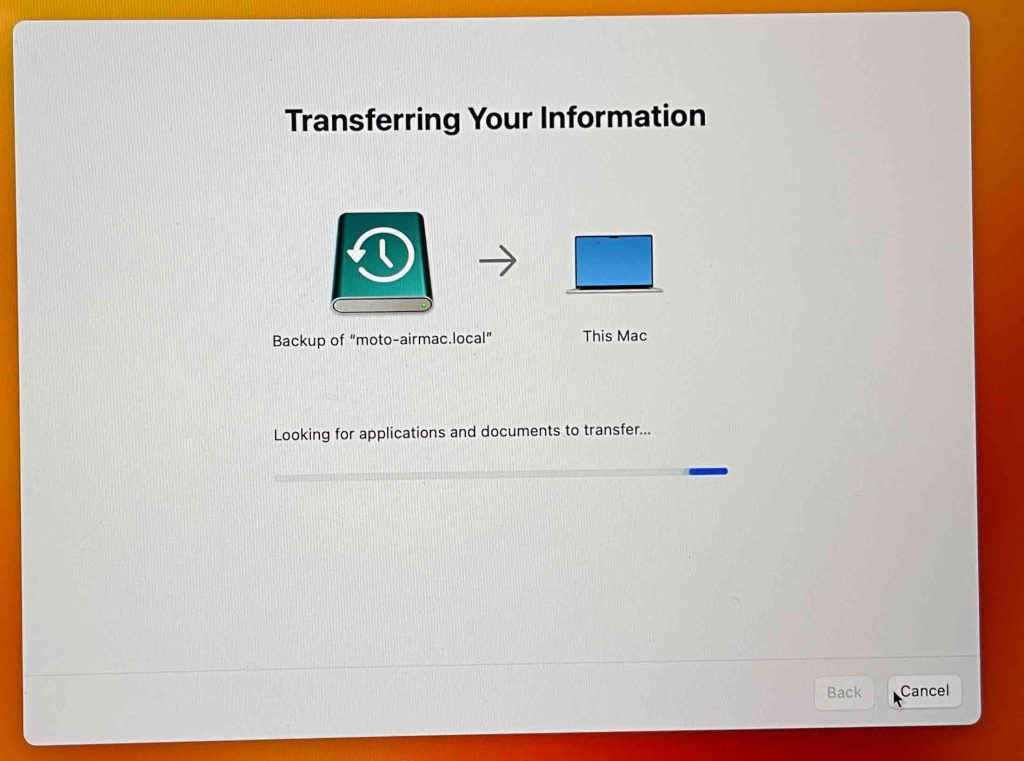
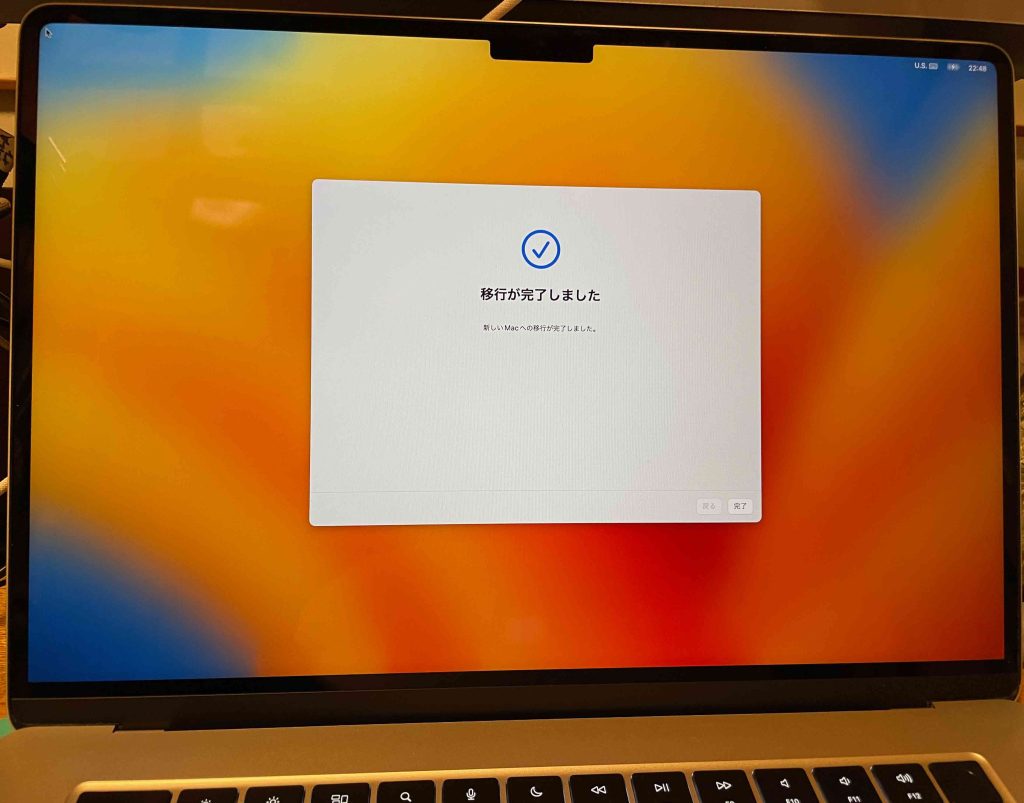
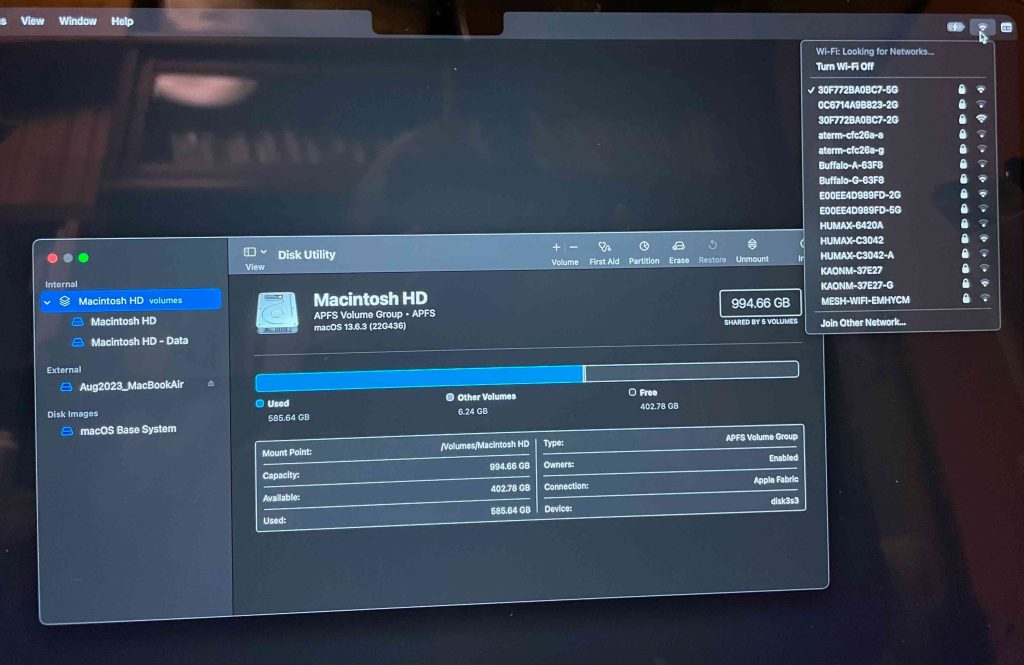
例によって,アップルケアに電話した。MacBook AirのWi-Fiは繋がらないので,アイフォーンのカメラを使っての,指導である。スタッフには丁寧に対応頂いたが,その指導は不適切であった。タイムマシーンで最新のバックアップ(不具合を含んでいる)をとってから初期化すると,その段階でWi-Fiと繋がったので,その後はアップルのダウンロードサイトからmac OS venturaをダウンロードして,タイムマシーンの最新のバックアップを使って,復元した。その復元が完了した時点で,また,Wi-Fiが繋がらない。まあ,当然ではある。この点をスタッフは指摘して頂けなかった。この過程はスタッフの指導によるものである。もちろん,最新のバックアップを取る段階にはサポートは終了している。
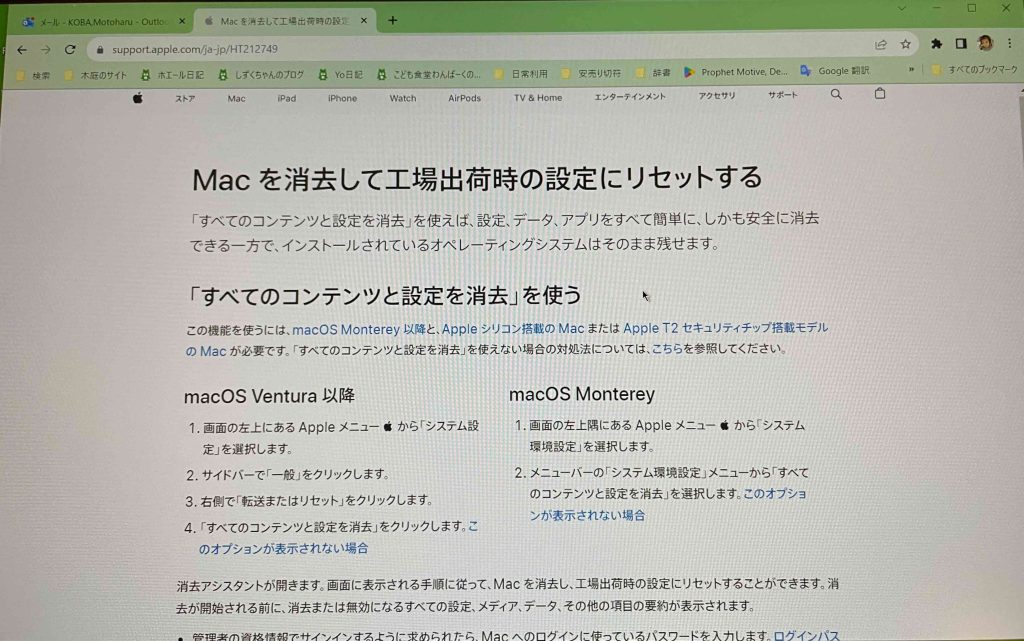
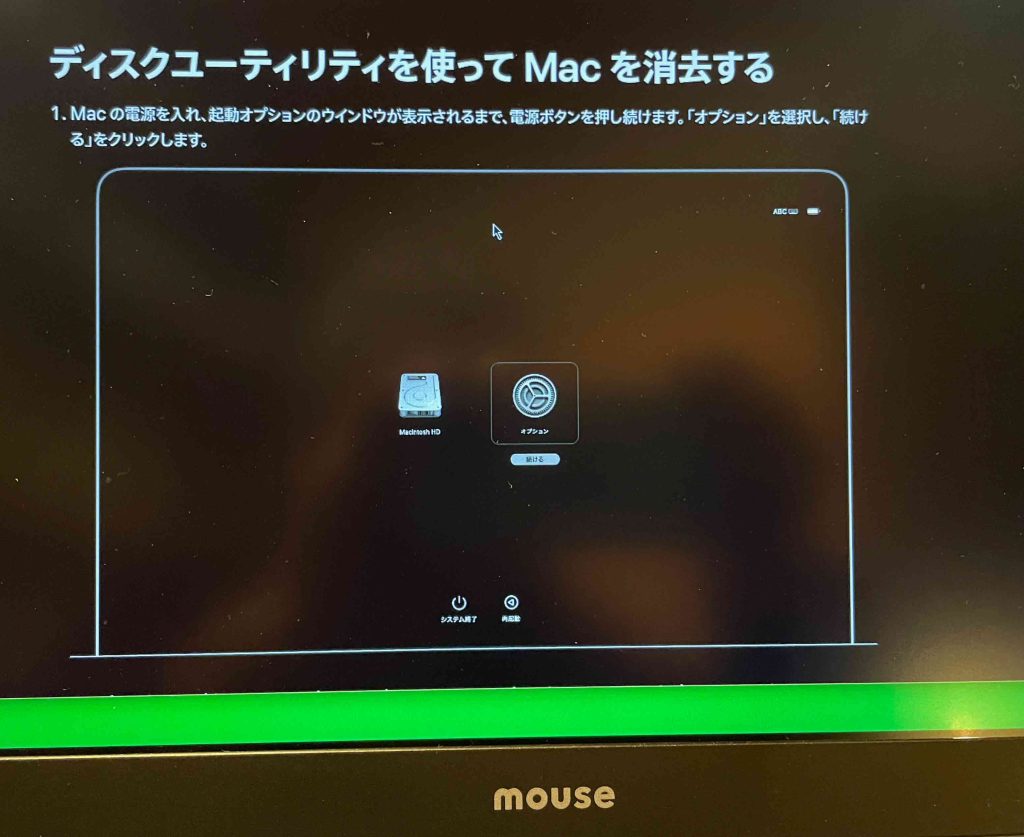
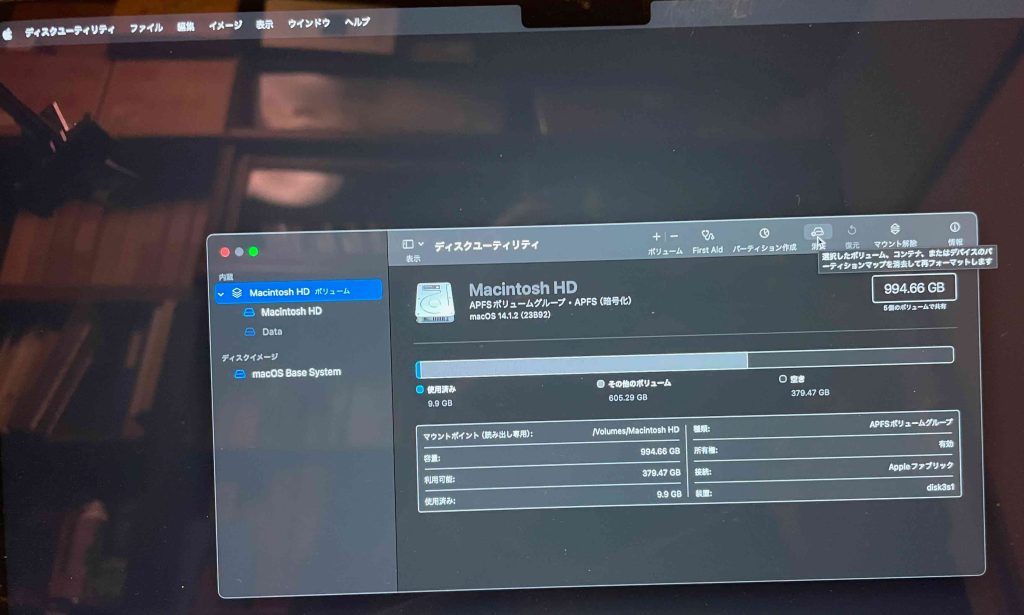
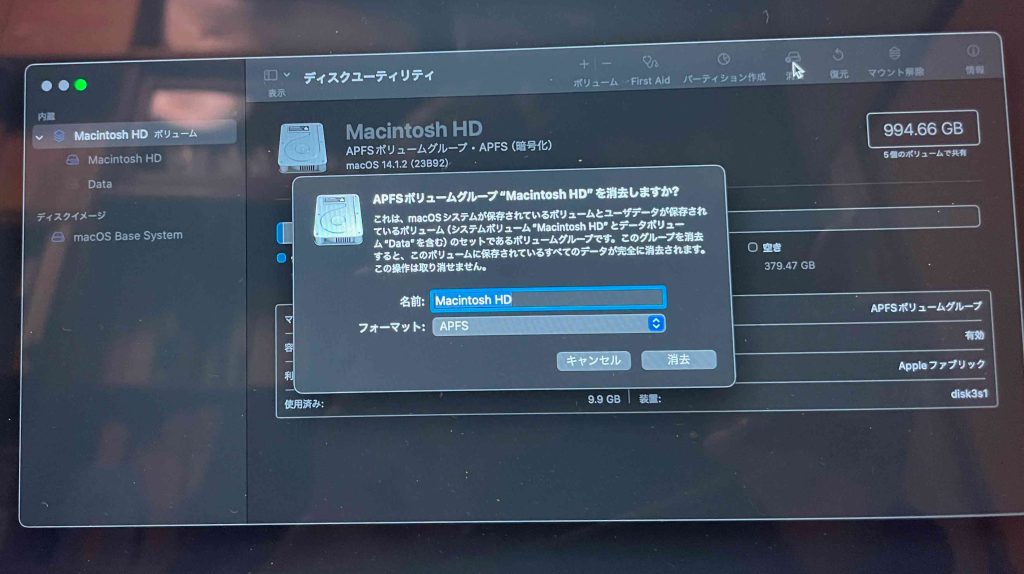
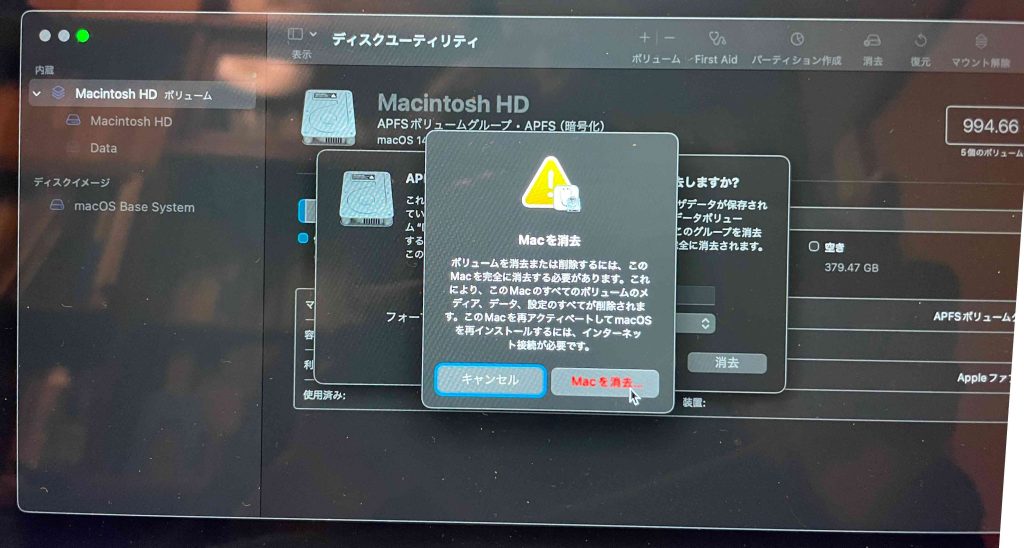
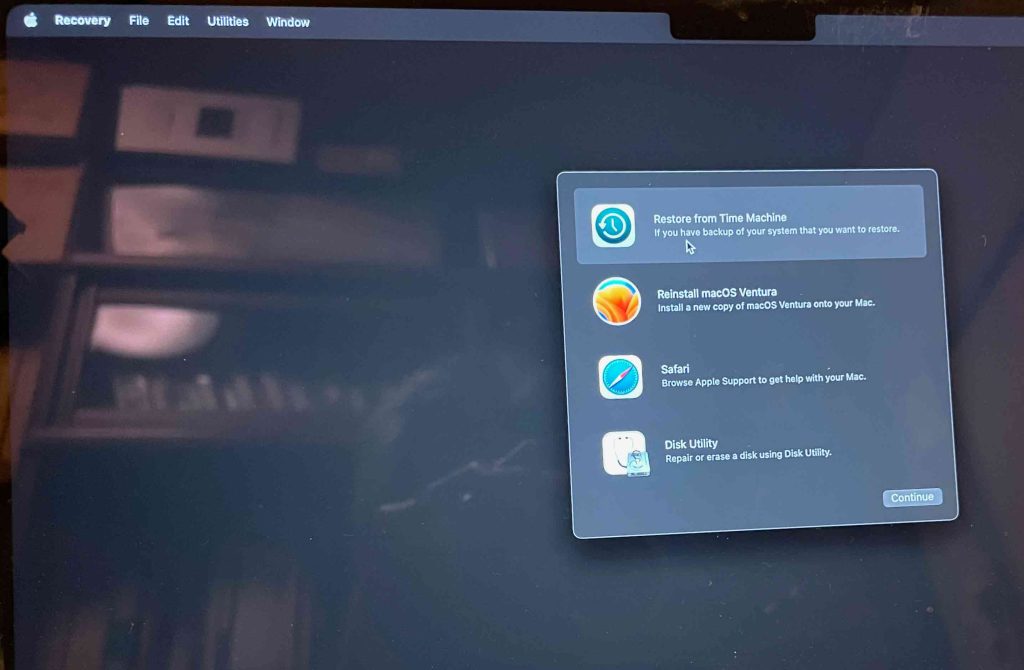
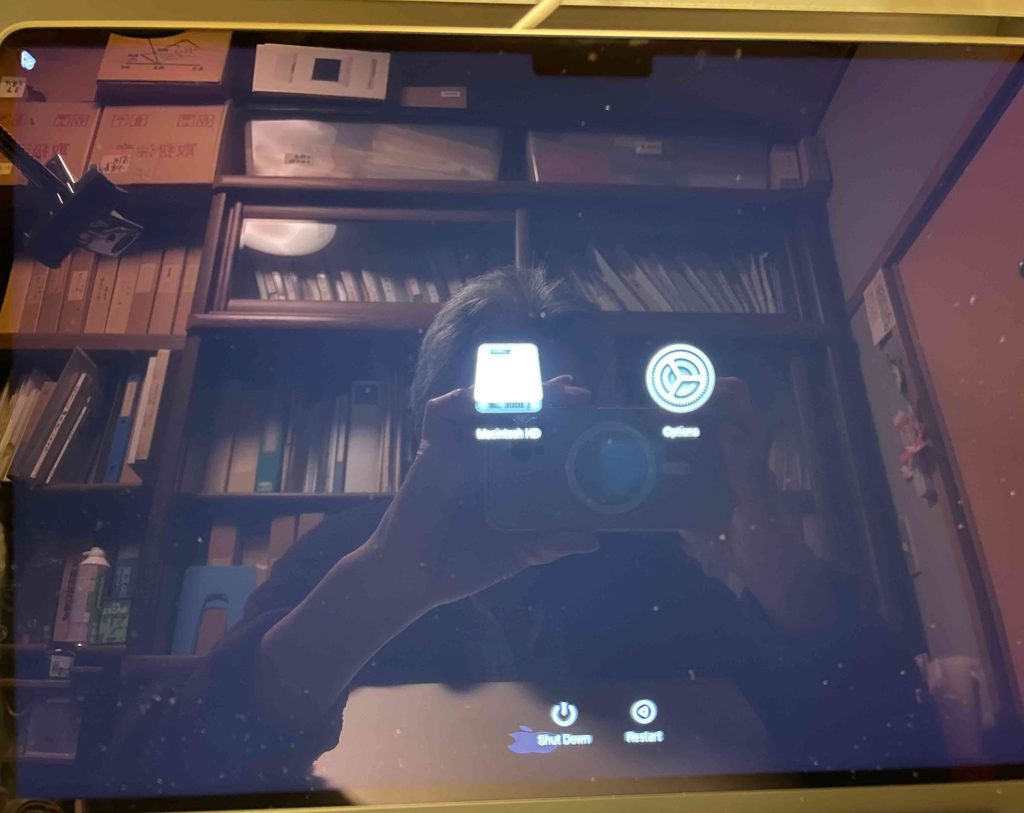
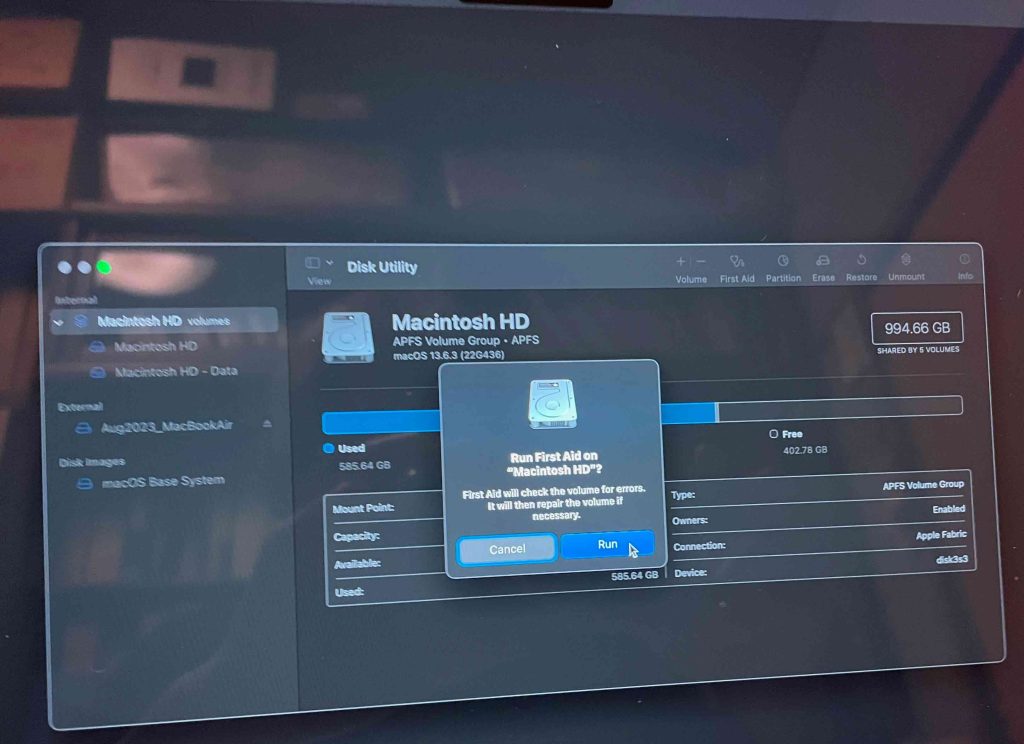
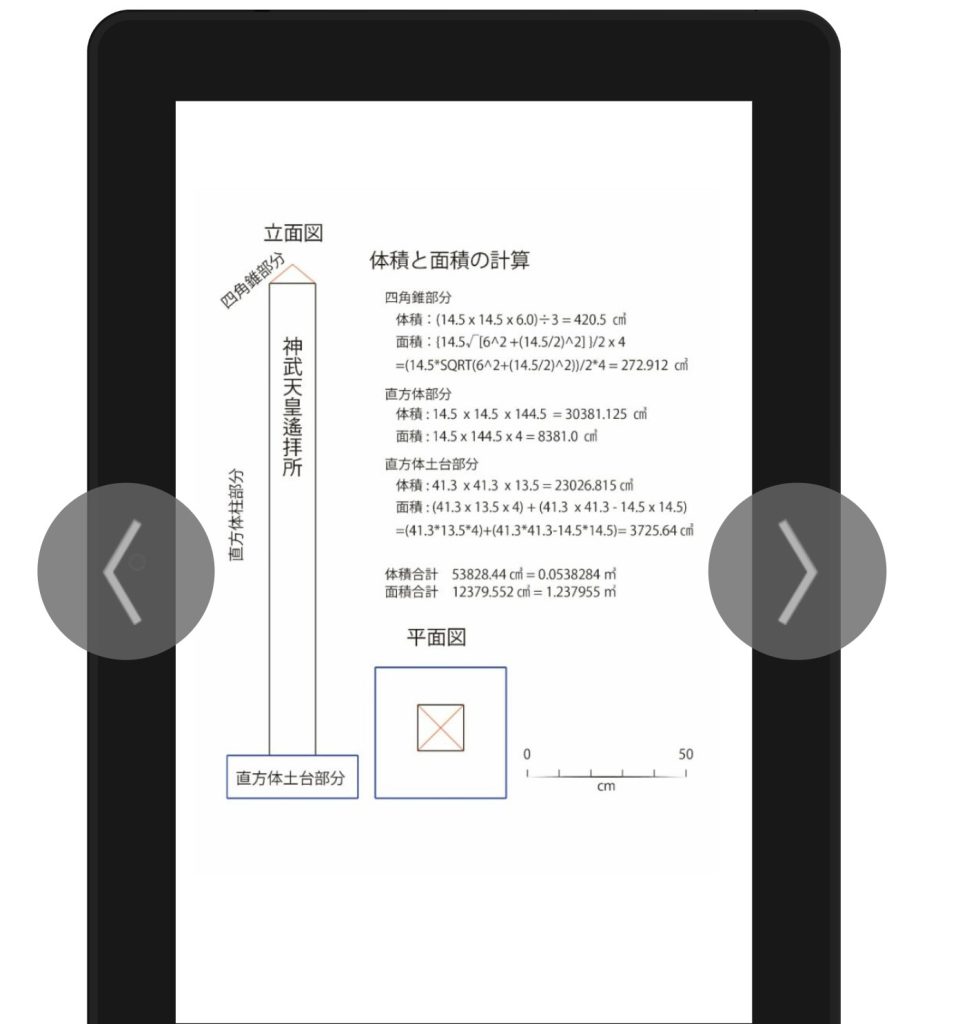
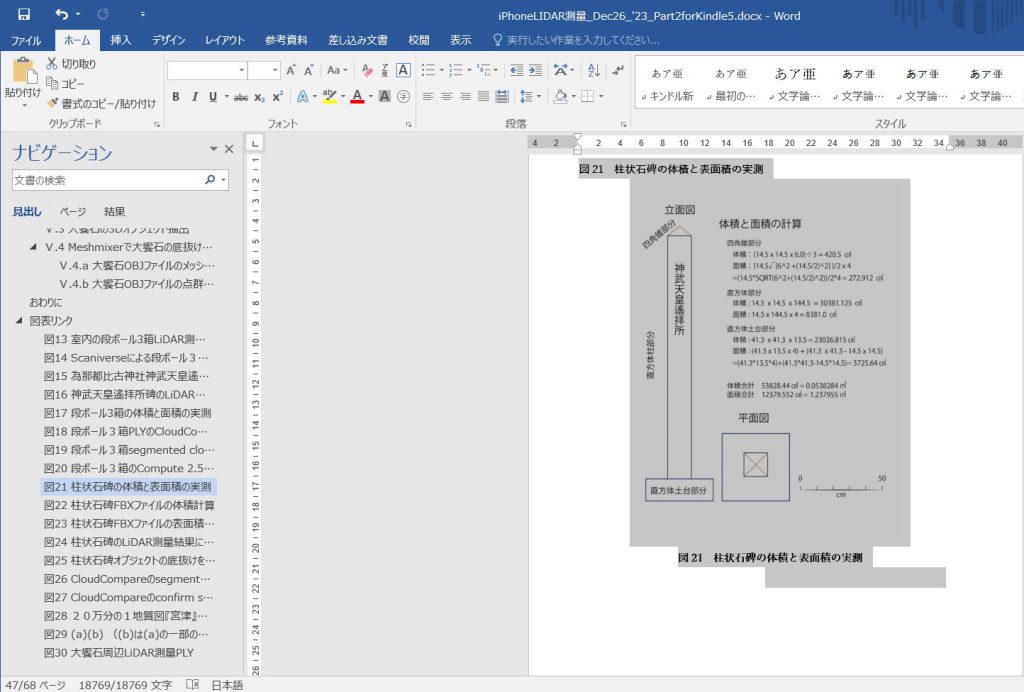
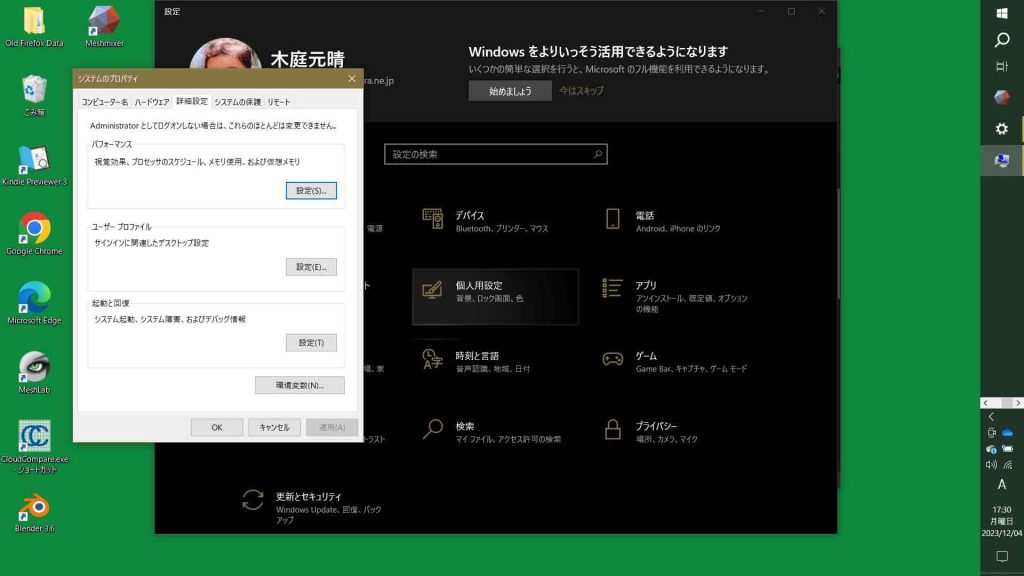
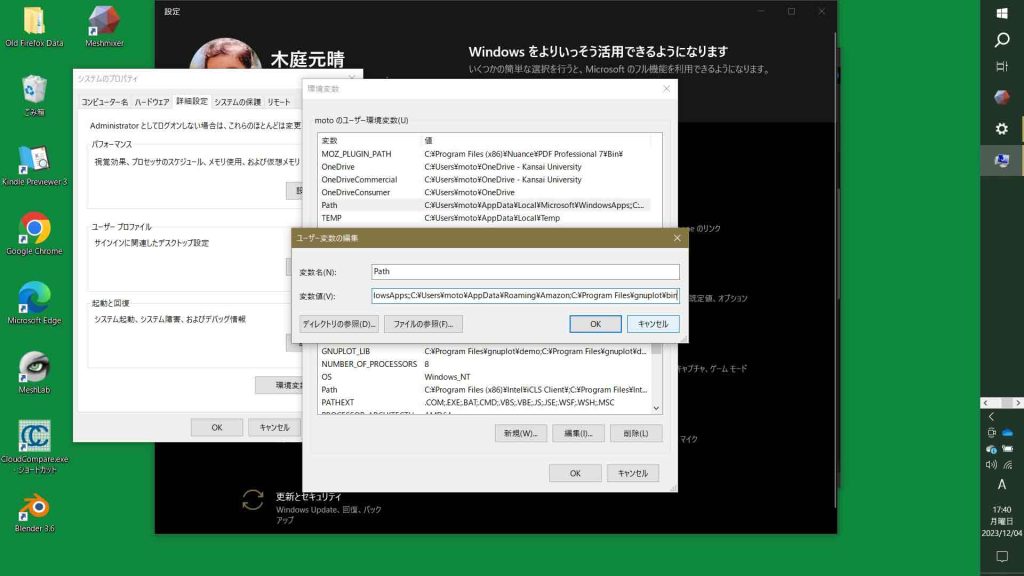
そこでパワーキーを長押しして,ディスクユーティリティを使うことになる。図5の画面が見えるので,オプションを選ぶ。図6のように,macのハードディスク Macintosh HD ボリュームを選び,消去アイコンを選択する。その結果が図7である。 なお,アップルケアでは,このMacintosh HD ボリュームの下位のMacintosh HD, Dataについて,下位から最上位のMacintosh HD ボリューム,まで,First Aidを実行した。意味がなかったのであるが。
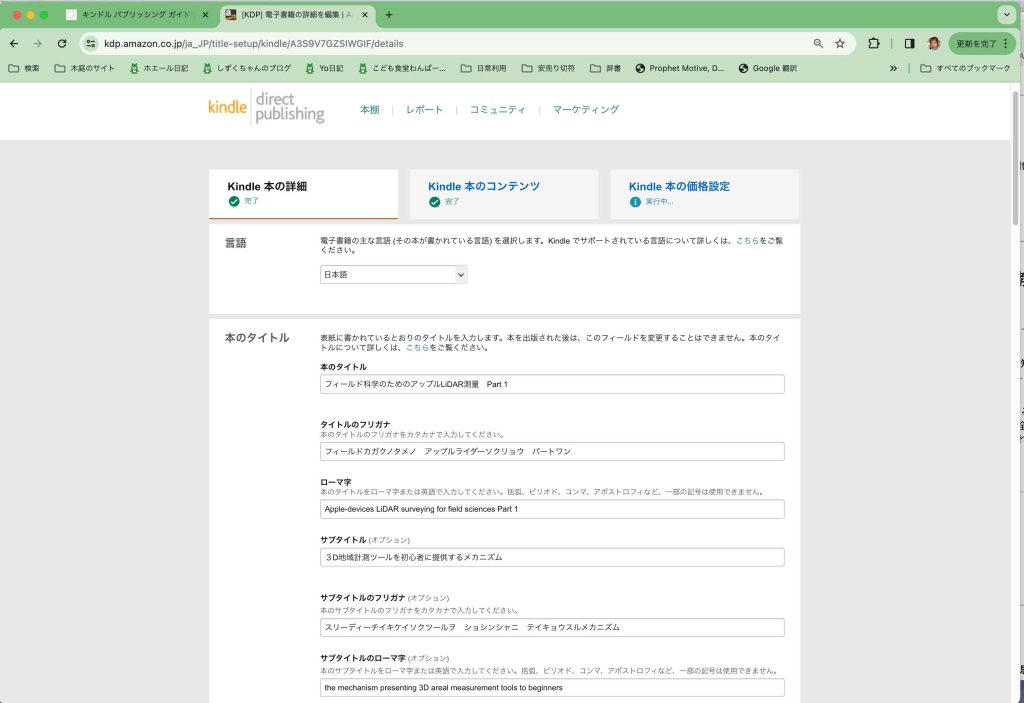
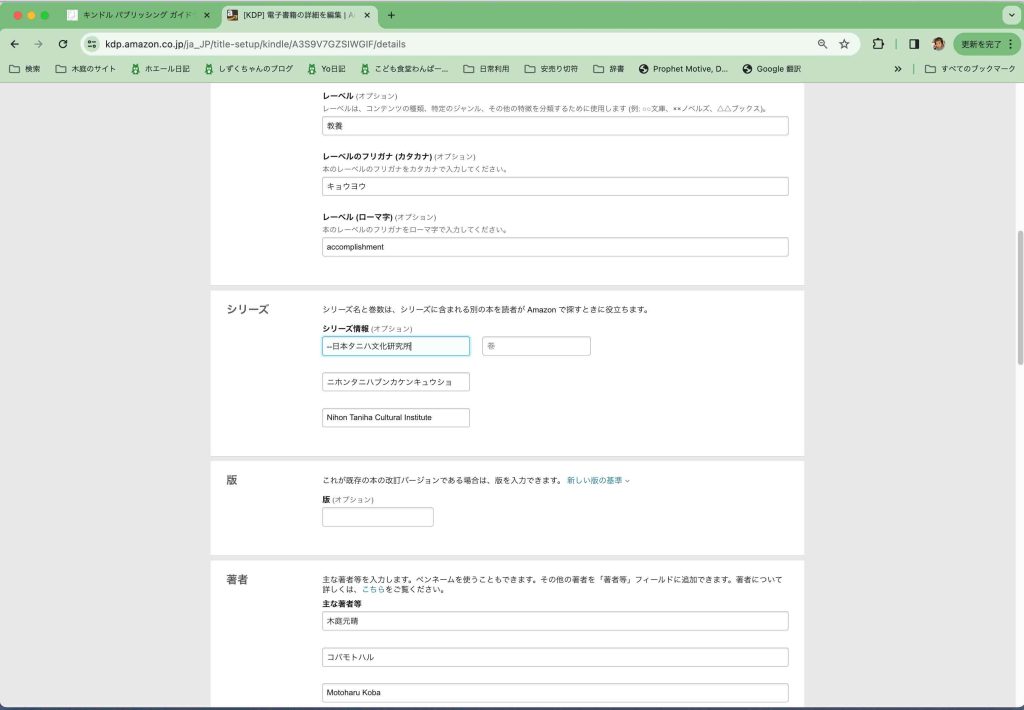
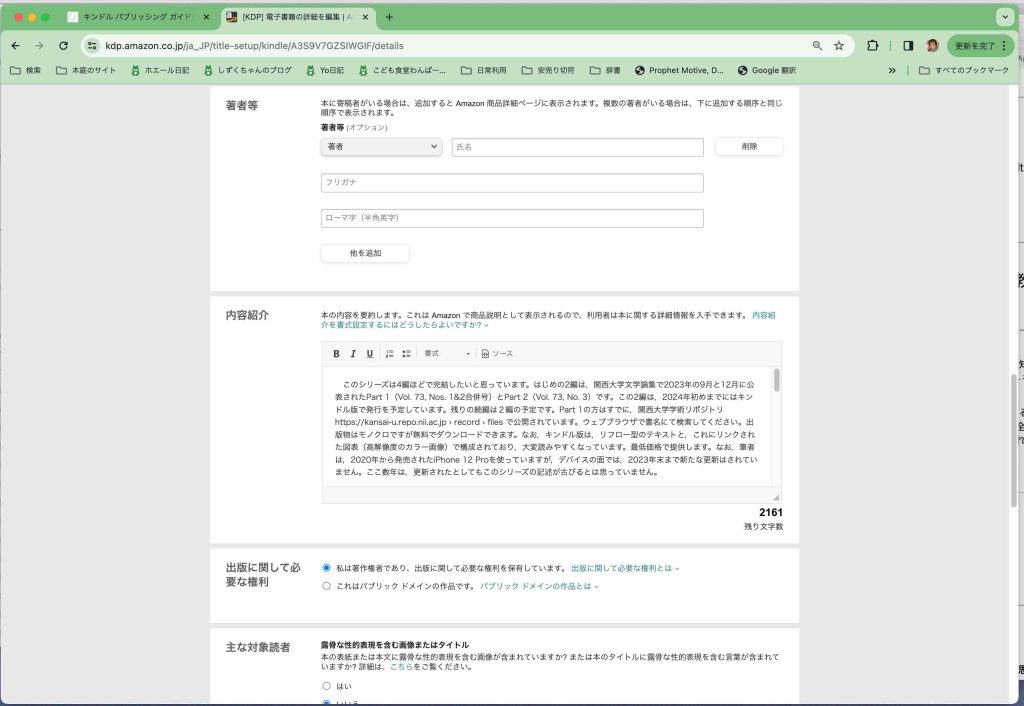
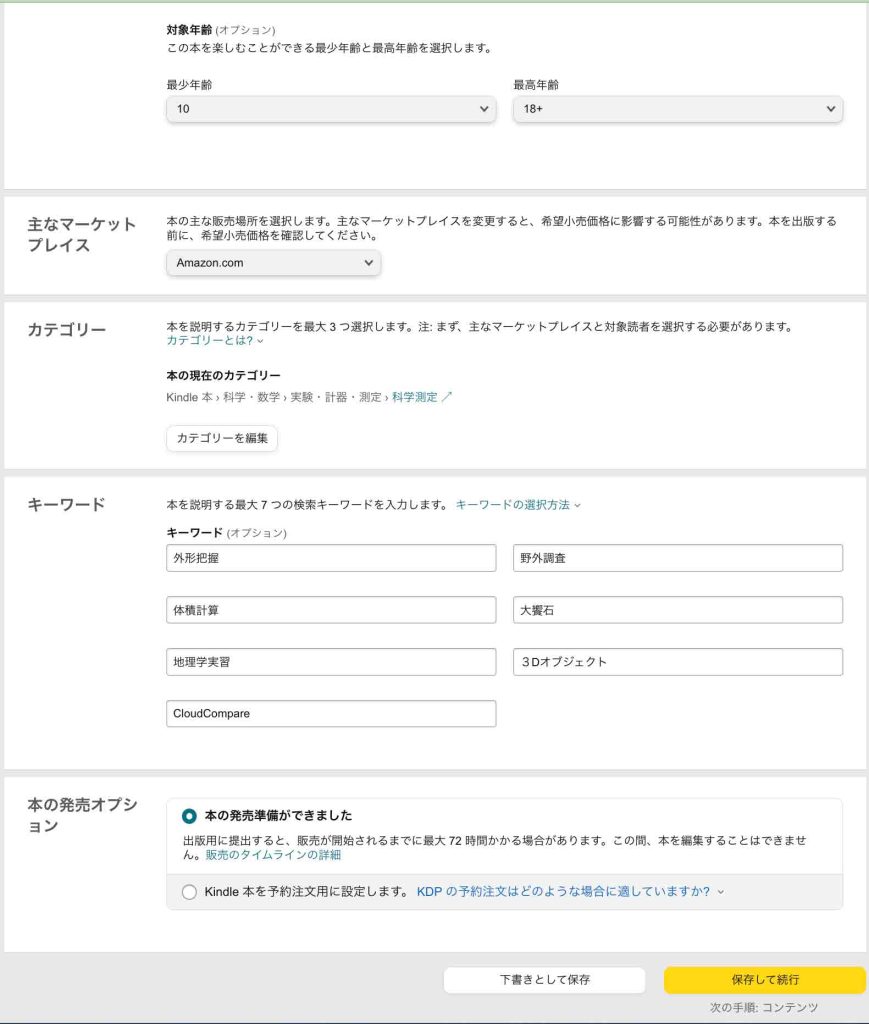
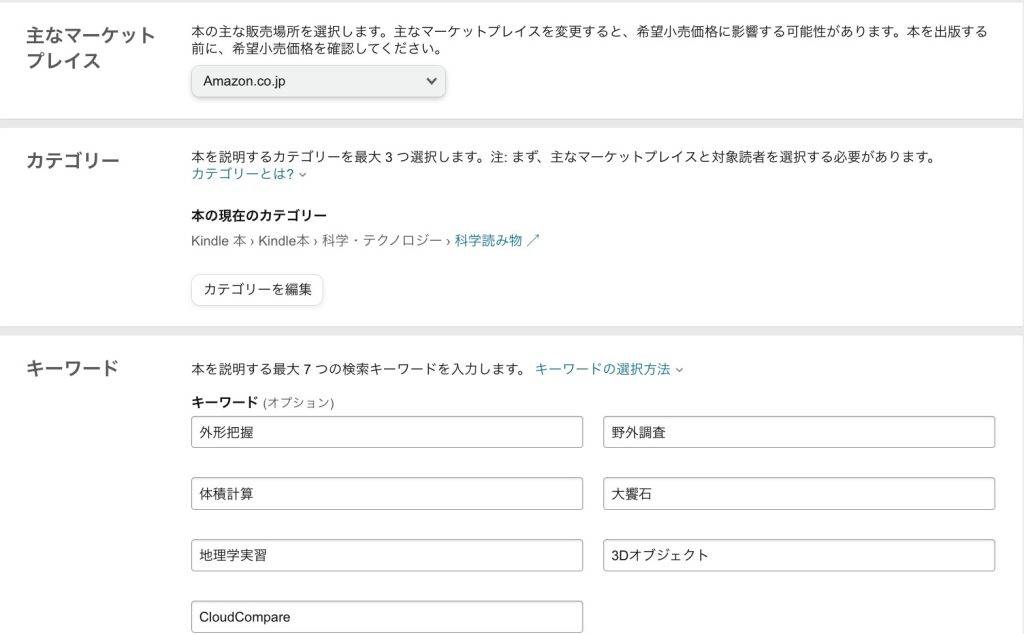
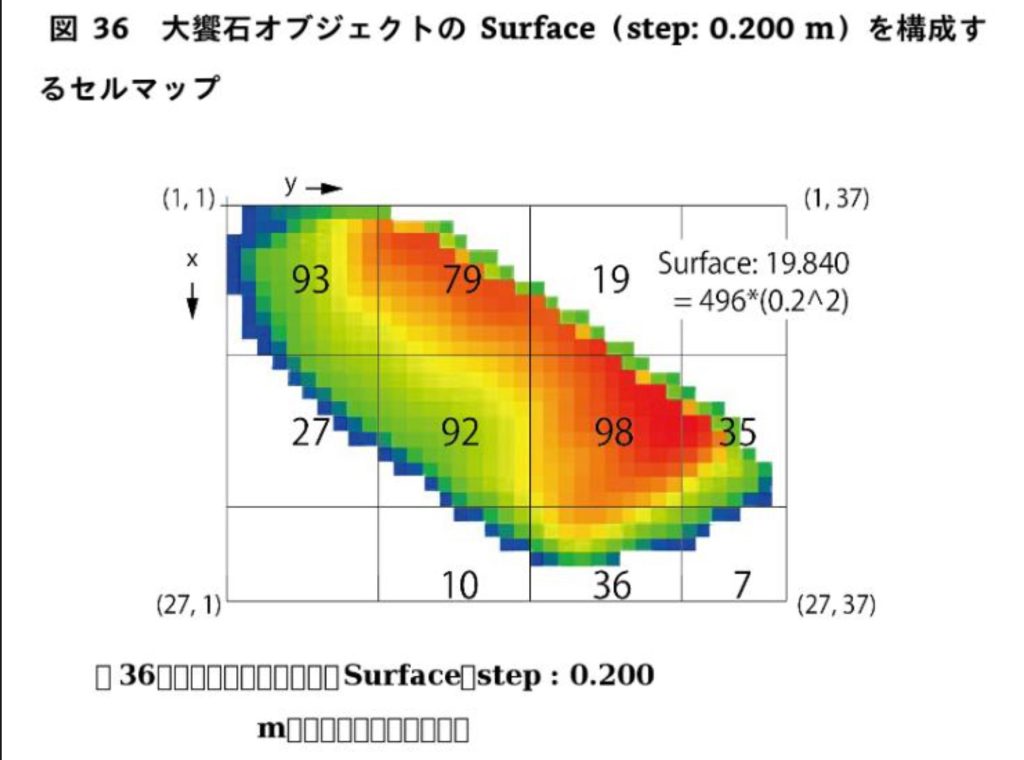
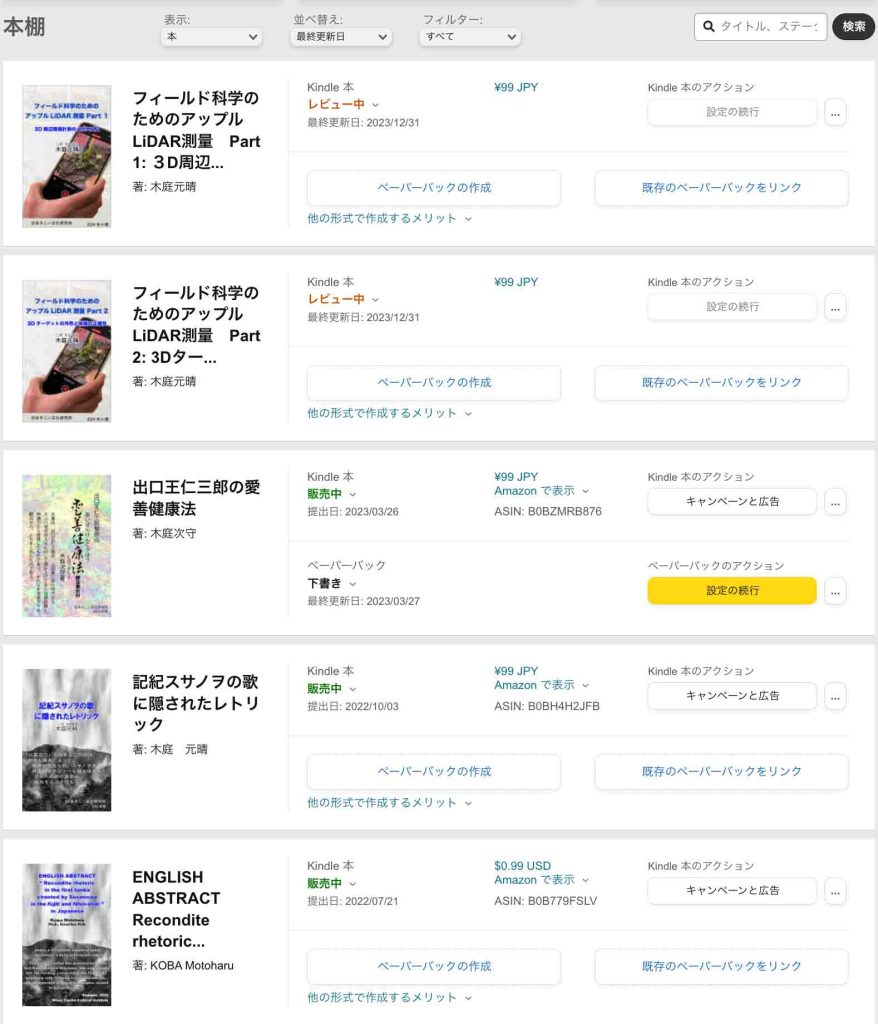
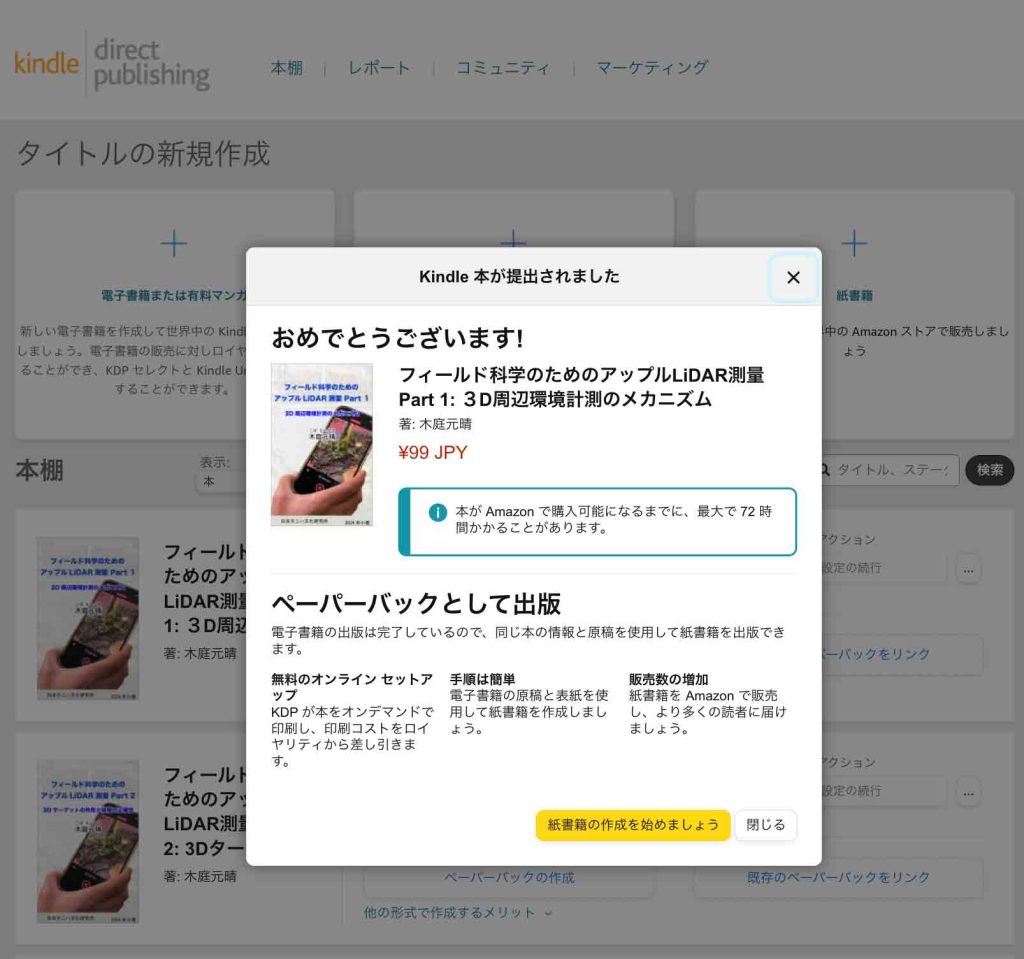
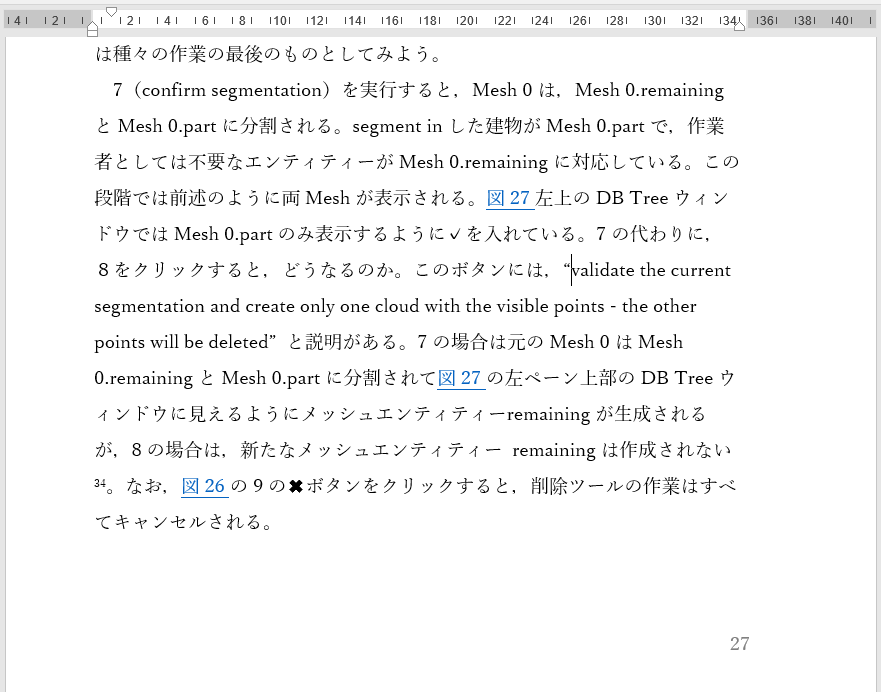
Kindle本の詳細で,本のタイトル > ローマ字,のところであるが,文学論集では,Apple’s LiDAR surveying for field sciences Part 1 としていたのであるが,このKindleサイトでは,受付られない。キンドルが特殊文字とするApple’sの「’」が撥ね付けられる。苦肉の策で,Apple-devices LiDAR⋯⋯⋯⋯,と変更した。サブタイトルが使えるので,本の内容をここで示した方が良いと考え,the mechanism presenting 3D areal measurement tools to beginners, を追加した。 図37のレーベルとは,キンドル版書籍の見出しに書名+シリーズ名の次に( )に表示されるもので,かなり目立つ。この部分を(教養)とするのである。専門性が感じられず悪い風景ではない。次のシリーズでは,–日本タニハ文化研究所,としている。経験的にこの「–」を頭に付加することで,書名とシリーズ名を分けて表現することができる。 図38の内容紹介は4000字まで許される。 ————————————————
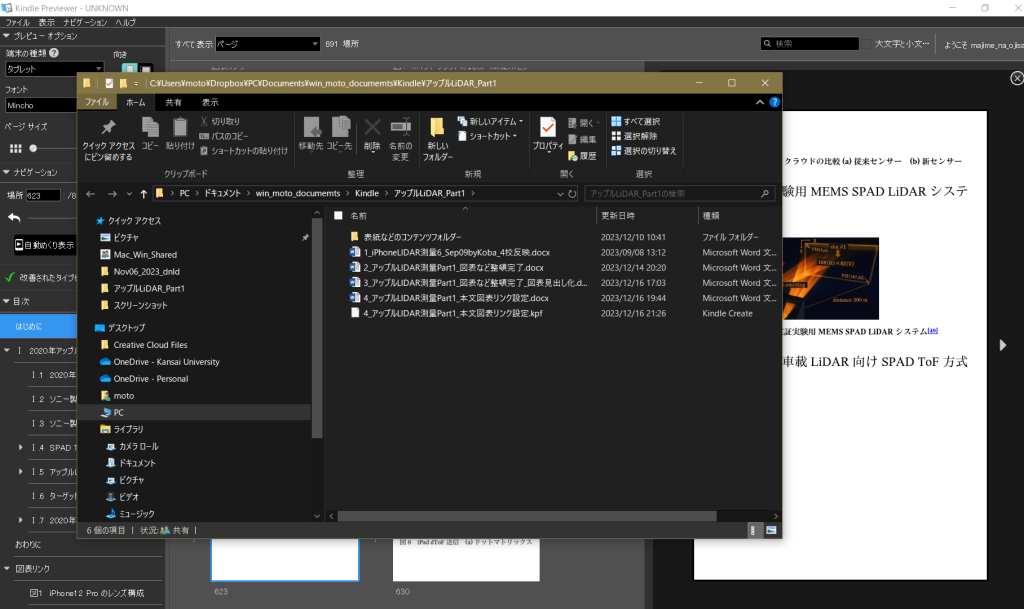
足かけ3日間ほど,試行錯誤して,正解に辿りついた。その契機は,wordでアップロードするとオブジェクト内のテキストが文字化けるする の KDP Forum Home の記事であった。KDPでは,テキストボックス自体が対応しない という事実である。テキストボックスというのは,Microsoft Wordでは,意識的に使う方は多くはないだろう。ぼくもMicrosoft Wordでは使わない。エクセルでは重宝している。
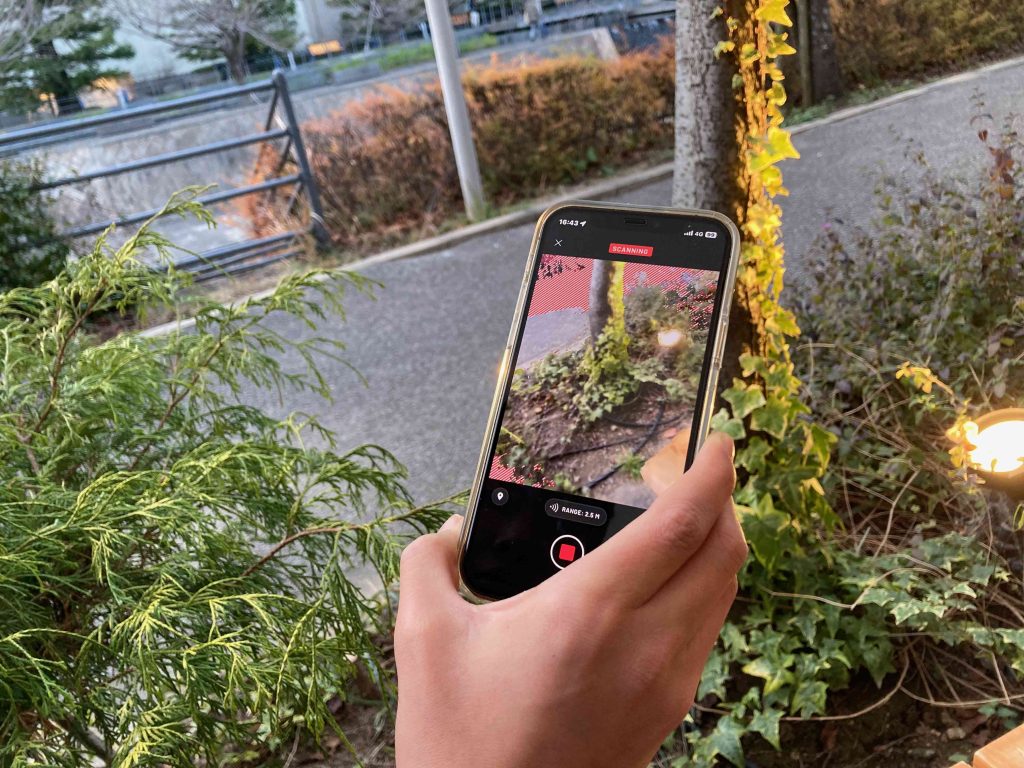
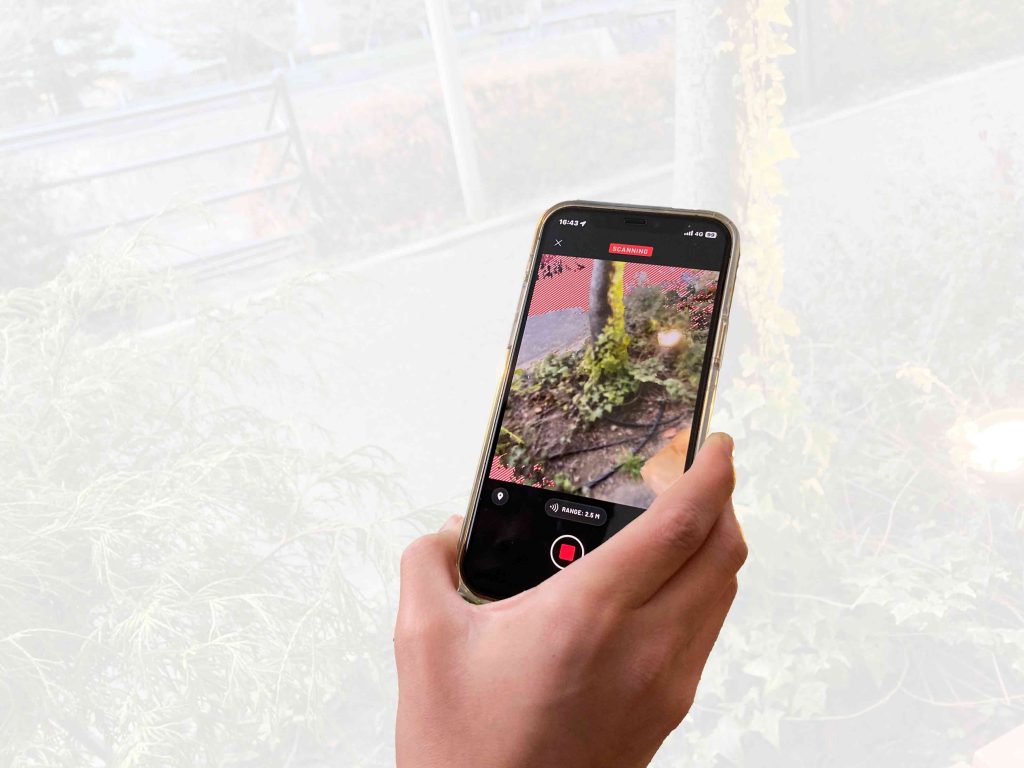
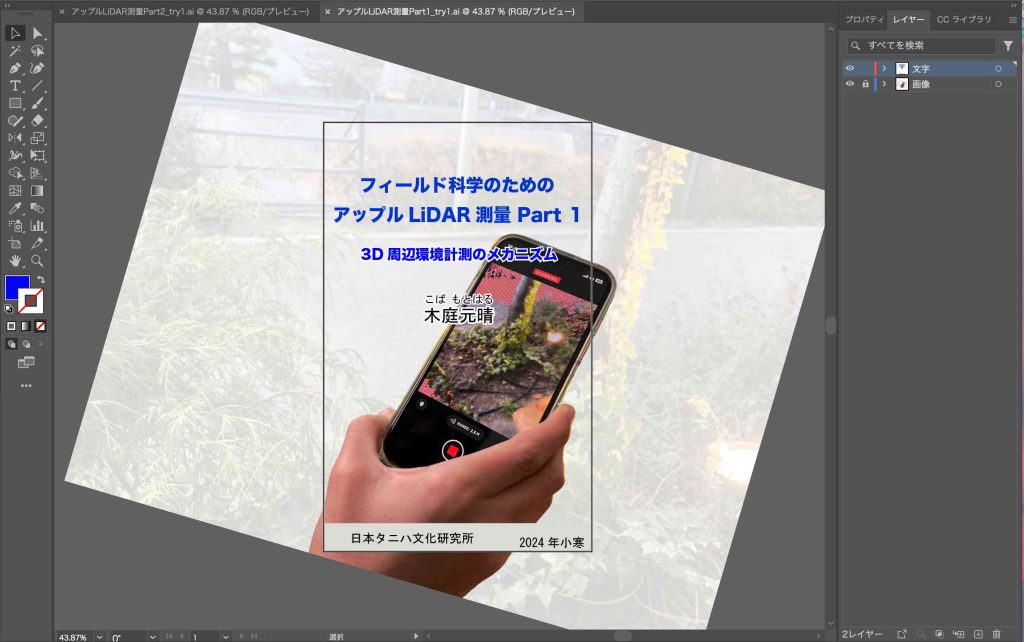
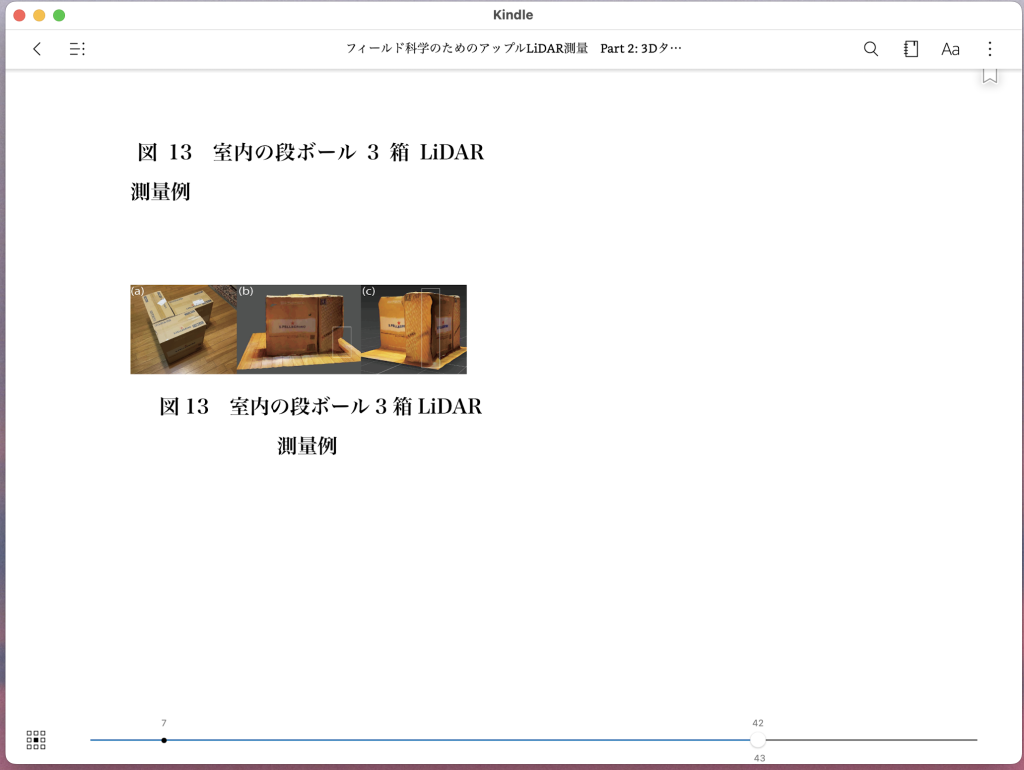
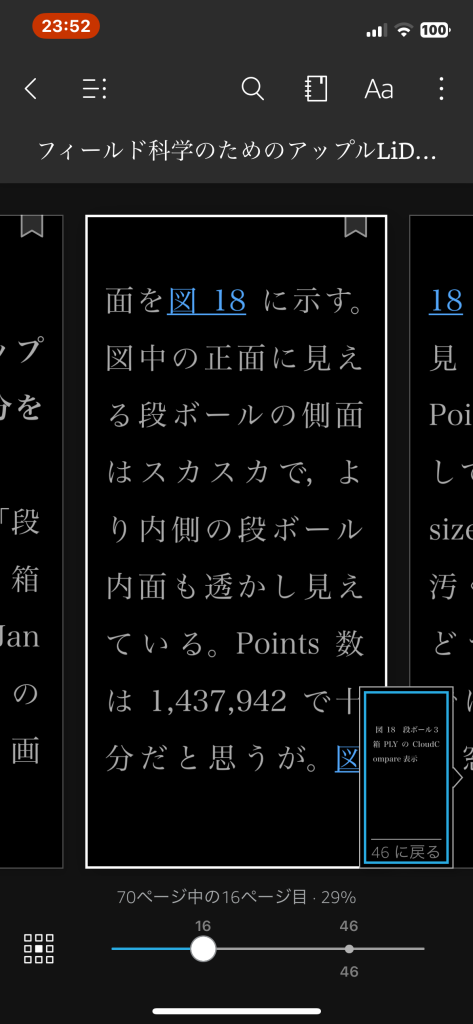
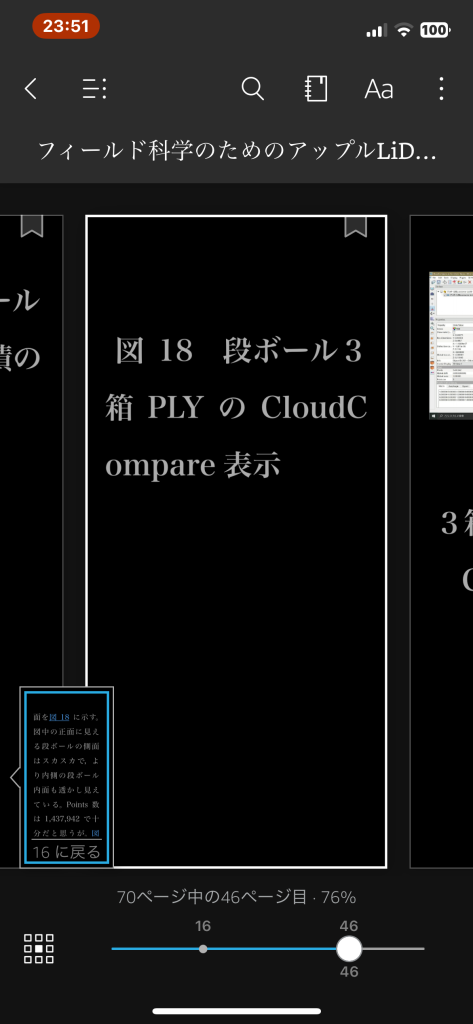
3 Part 2の「Ⅱ.1 室内に置いた段ボール3箱」の,第3段落では,Scaniverseのオブジェクトキャプチャーの特性のようなものを記述している。Kindle本の表紙を作成すべく近所のショッピングセンターでScaniverseを実行していて,第3段落の記述に誤りがあることに気付いた。その修正をした。Scaniverseのスキャン能力には脱帽である。
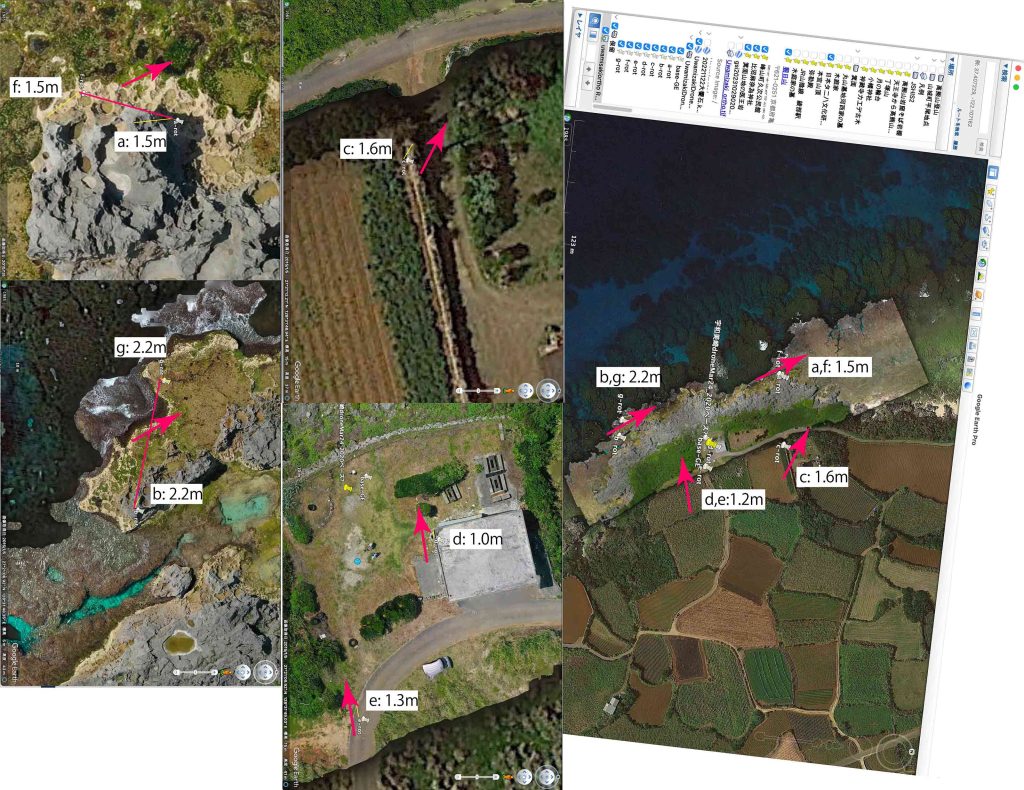
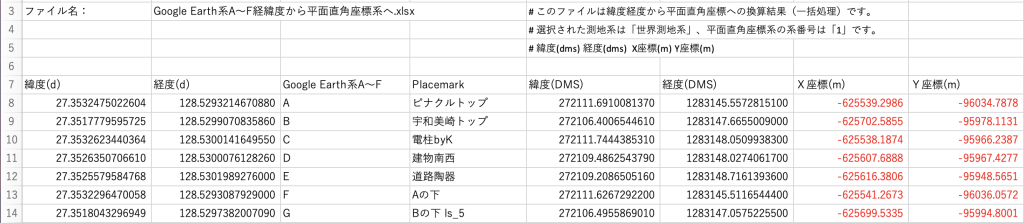
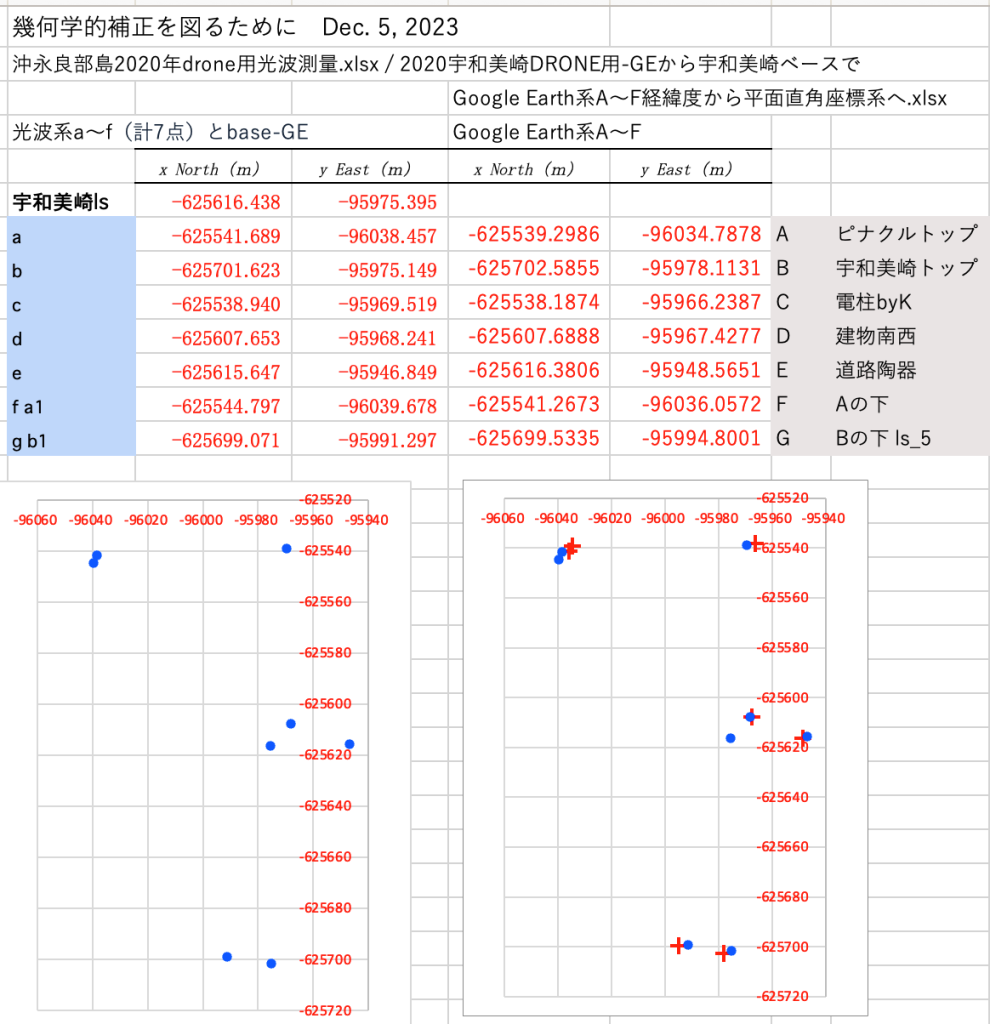
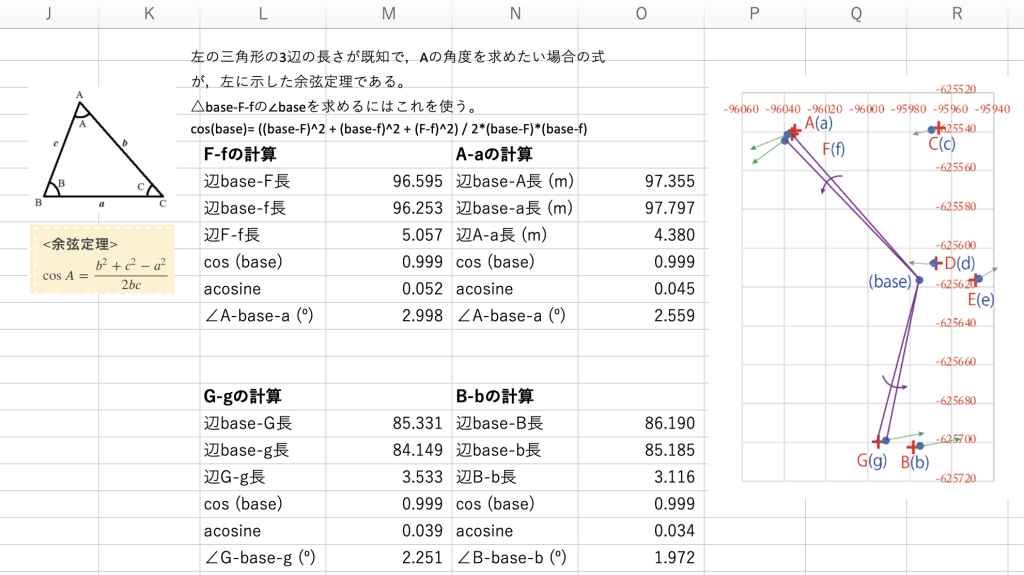
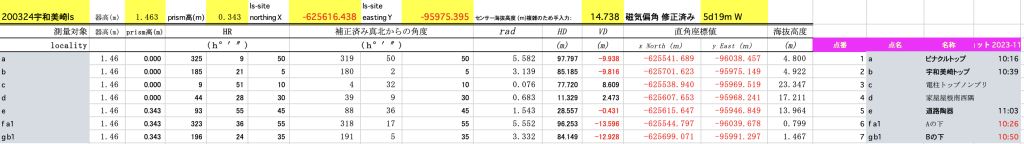
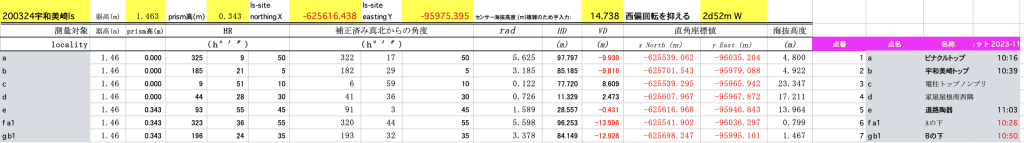
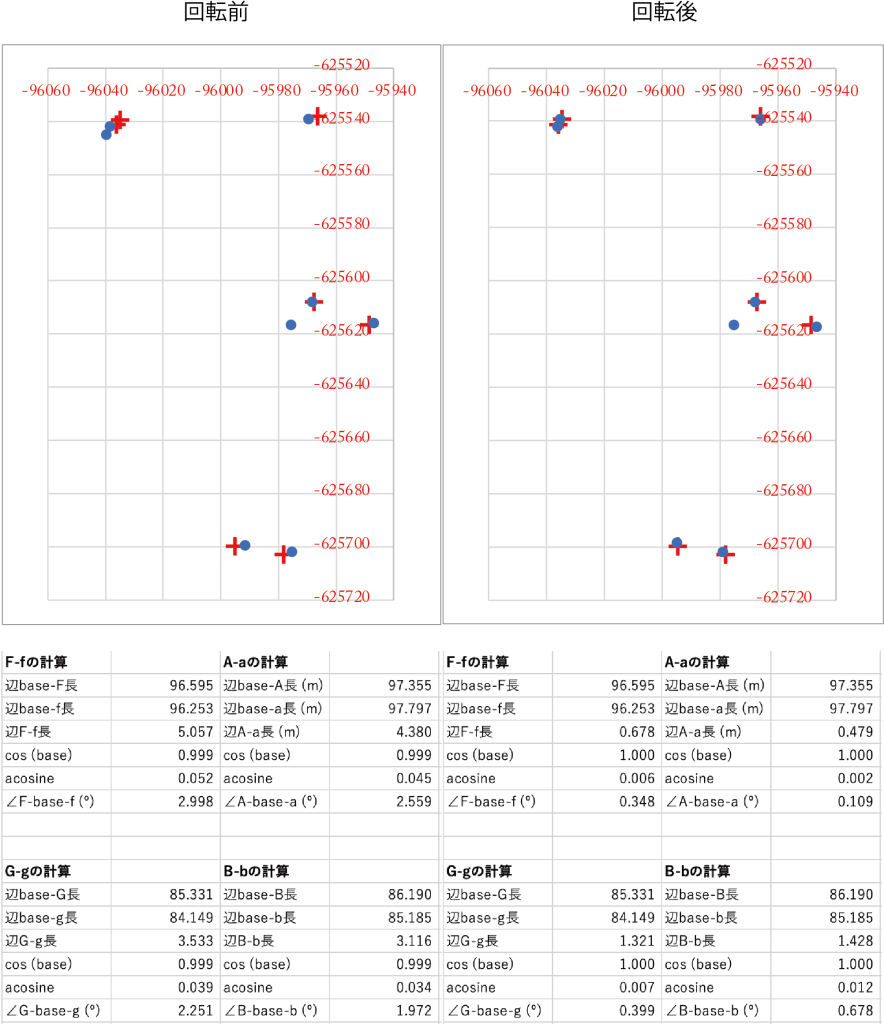
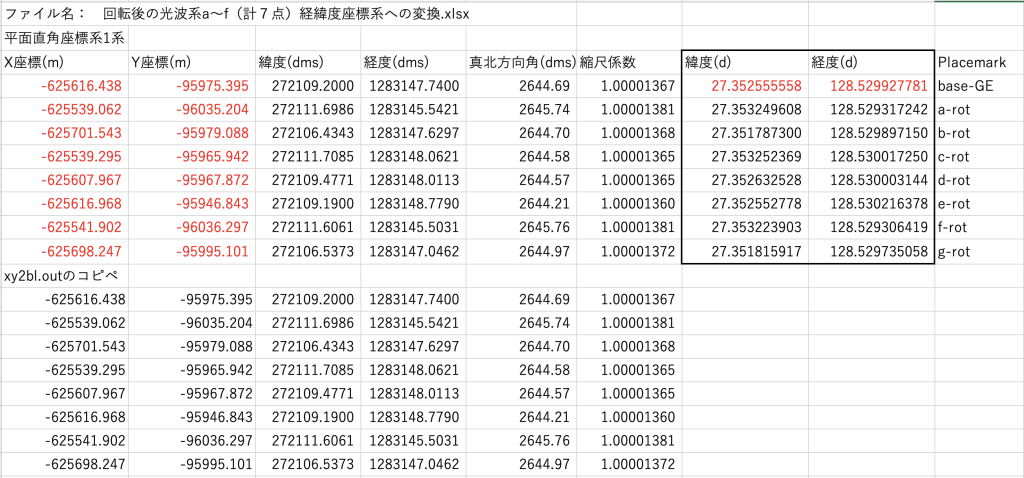
光波測量結果とグーグルアース画像とを平面座標系で補正する試み aim for suitability correction btw electro-optical distance measurements and Google Earth’s images using the coordinate plane
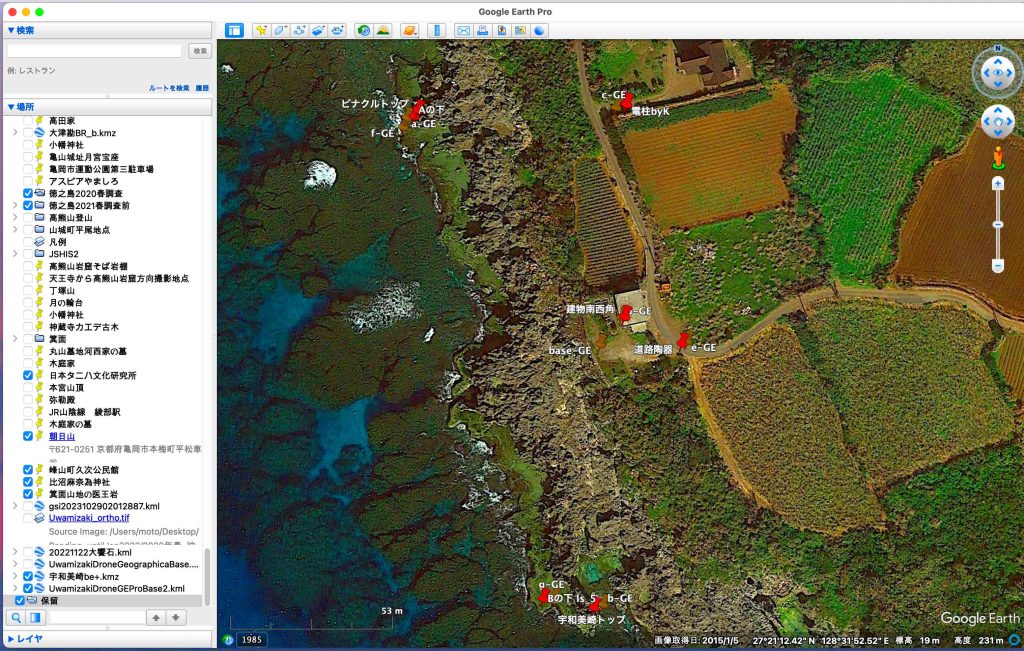
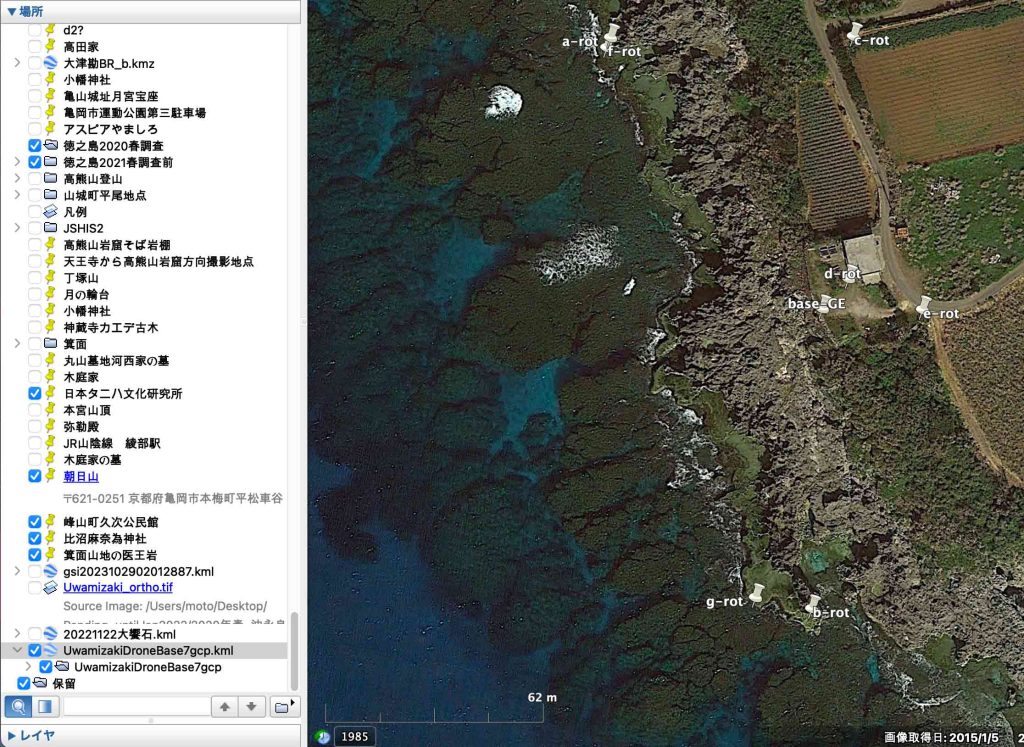
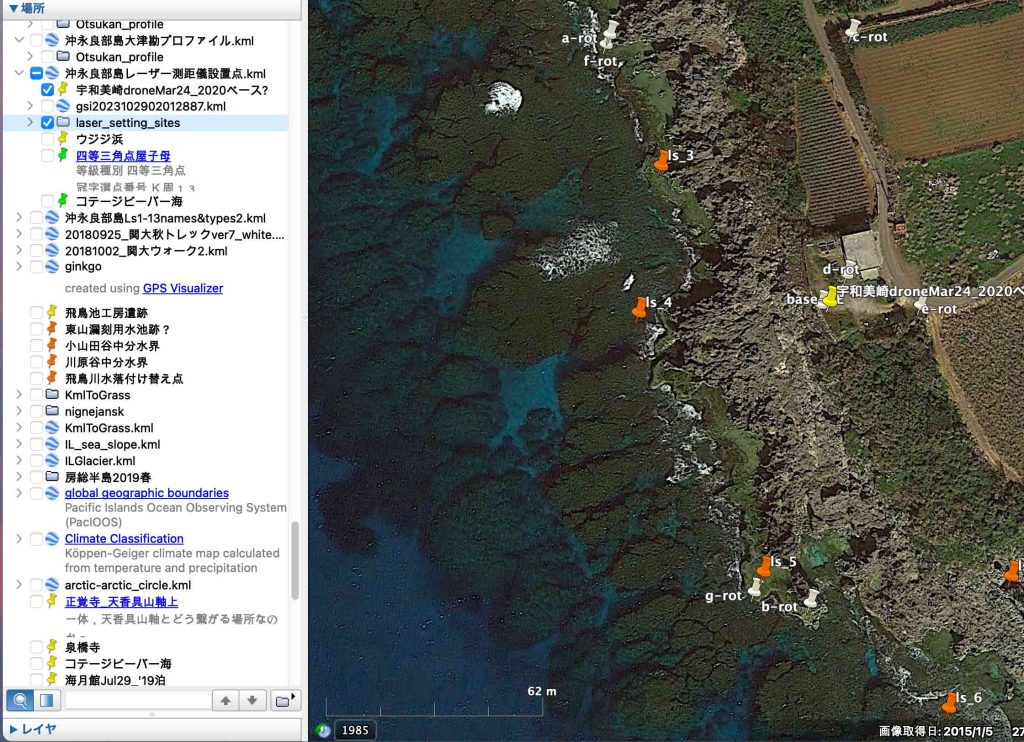
Google Earth系A〜F(計7点)は固定点である。光波系a〜f(計7点)とbase-GE(計8点)は修正が可能である。base-GEを移動すると,光波系a〜f(計7点)も計算式に従って,変わる。iterationの手法を使えば,北西部分と南東部分の各2点の誤差角度の平均値を揃えることは可能である。(base)を最大2mほどだろうか南方に移動すれば一致する筈である。
本格的な散布図の作成アプリGnuplot a real tool ,Gnuplot, for making scatter diagrams
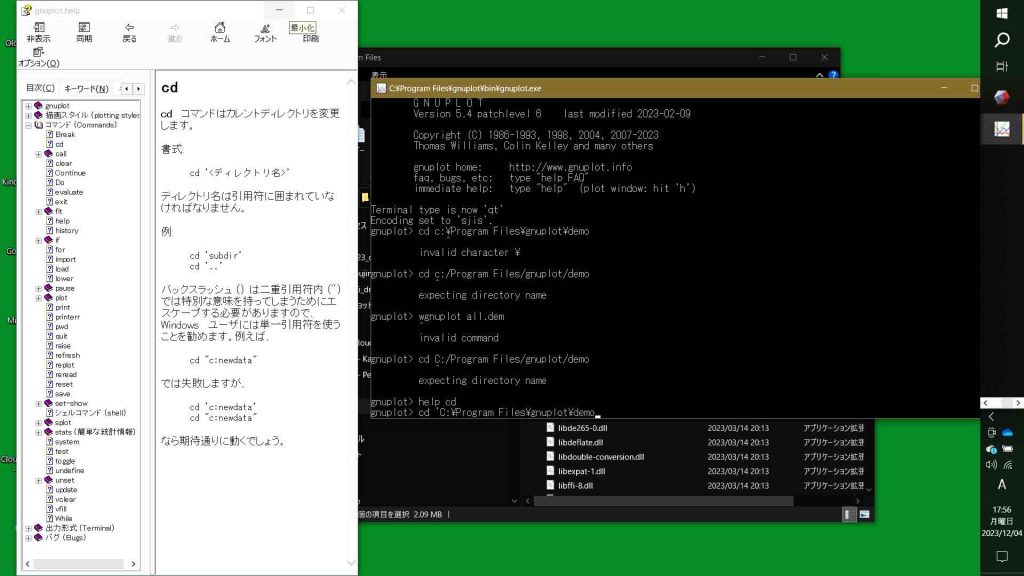
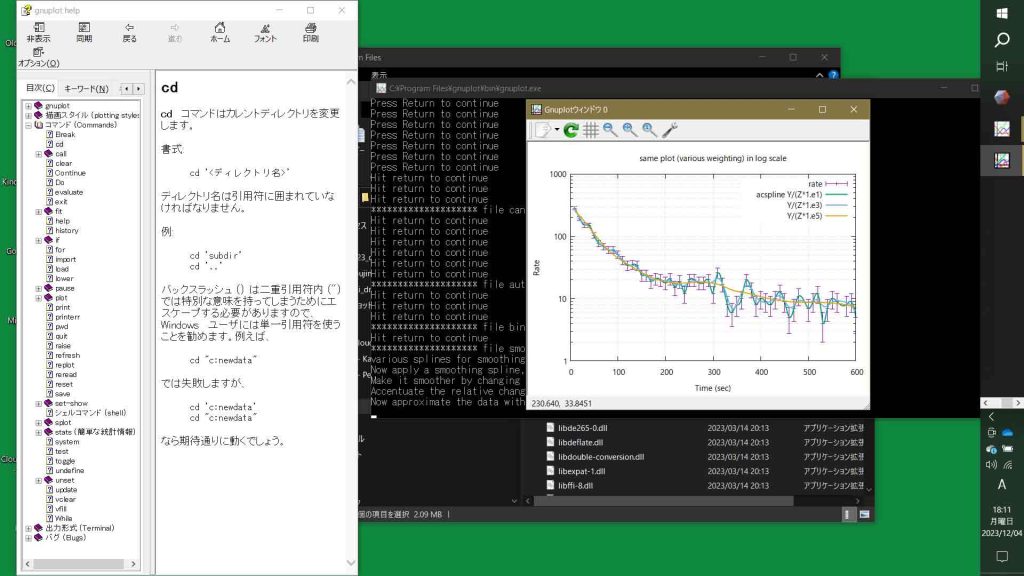
1. Gnuplot
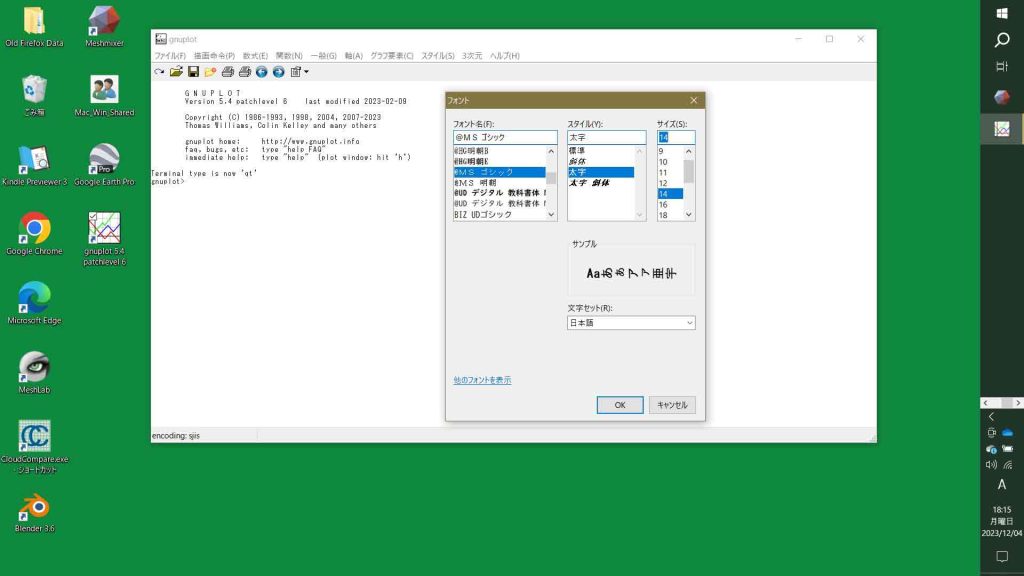
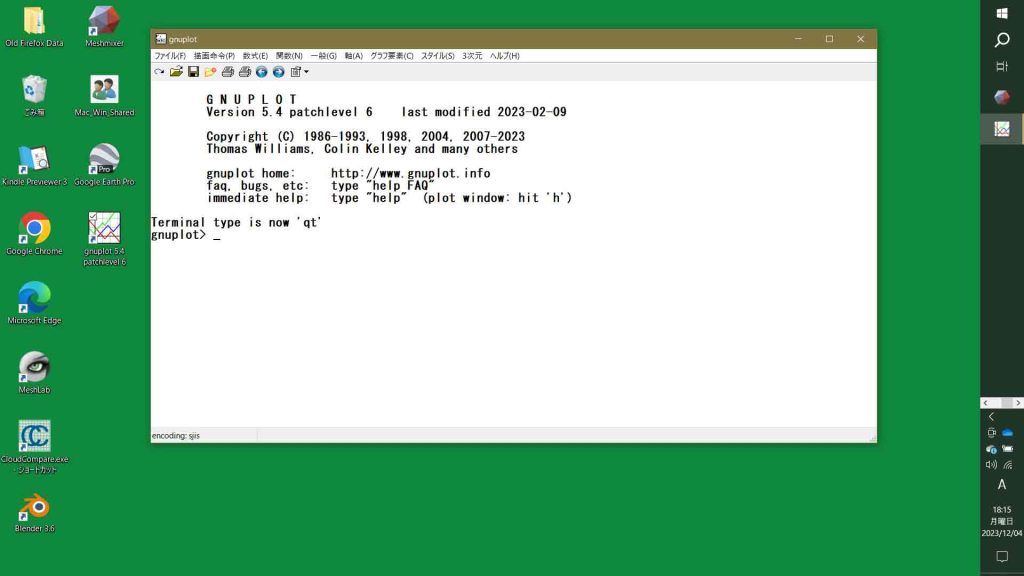
Microsoft Excelでは,まともな散布図は作成できない。Microsoftのサイトでも,これに対処するための補助プログラムを提供している。しかしながら,これでも,まともな散布図を作成することはできない。 アップルデバイス付属のNumbersも同様だ。表計算ソフトは,横軸(X軸)が名目軸であるためだ。だから,関数アプリが必要になる。以前はぼくも簡単な散布図作成アプリを作成したし,ある研究者の3D散布図アプリを購入したこともある。いずれも散逸した。OSのアップグレードなどで使えなくなったこともある。 やっぱり,Gnuかあ,という印象だ。ある電子辞書には,「GNU 名《コ》グヌー、グニュー◆Linuxを中心とするUnix風のフリーソフトウェア・システム(を開発するプロジェクト)◆GNUは、GNU’s Not Unix「GNUはUnixじゃない」の略とされる。説明文中に説明されるべき言葉GNUが再び入っていて説明になっていないが、逆説的に無限の精神を象徴◆【URL】http://www.gnu.org/」とある。
大城直樹博士による Gnuplot 入門書 (注: Not Found The requested URL /~oshiro/Doc/gnuplot_primer/ was not found on this server)亡くなったのかどうか。これはhttpのままかも。
gnuplot への第一歩 by 小栗巣治博士 (注: このサイトにアクセスできません lagendra.s.kanazawa-u.ac.jp にタイプミスがないか確認してください。)亡くなったのかどうか。これは消失している。
2. Content Files for Gnuplot 5 2nd edition
この開発者に敬意を払う意味も込めて,デジタルブックを購入した。このダウンロードサイトには,
Content Files for Gnuplot 5 2nd Edition The files listed here under laptop and tablet formatting contain the exact same content, but are formatted to work best on typical screen shapes for different devices. You are welcome to view or download both versions if you wish, to see which one works better on your device, or to use the book on your various devices.
HI Arun, For some reason, your post just showed up in the Google Earth forum today, May 12. The digital elevation model used for most of the earth is from the SRTM recorded in February 2020. It’s a general survey and not specifically accurate by any standard. It simply happens to be the only digital elevation data that covers most of the earth. In the US, elevation data points are 30 meters apart and everything in between is interpolated. In other areas, the points may be 90 meters apart. The Jet Propulsion Lab will only guarantee accuracy of the data points as +/- 16 meters 95 % of the time.
There’s no documentation of how the elevation profile works. Over the years, it has had various glaring errors. You can’t use it for the level of accuracy you’re looking for.
I know that doesn’t help but it’s the situation that exists.
上記中の精度の記述で注目されるのは,赤字の部分だ。only guarantee accuracy of the data points as +/- 16 meters 95 % of the time これには驚いたし,なるほどと納得された。
さらに,他の技術者が回答している。
Alchemist251 Diamond Product Expert May 14, 2021
Arun, the ruler path tool doesn’t consider elevation change. This is in line with how surveyors measure property. So, if a piece of property contains a cliff, you get the face of the cliff for free. That doesn’t help hikers much, I know.
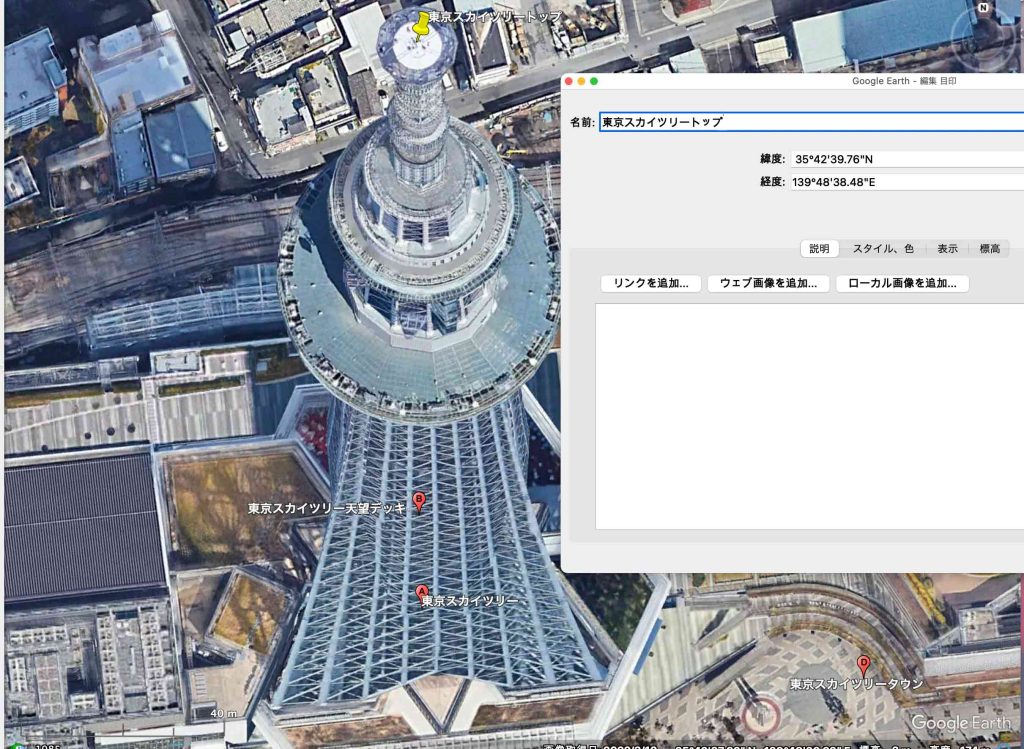
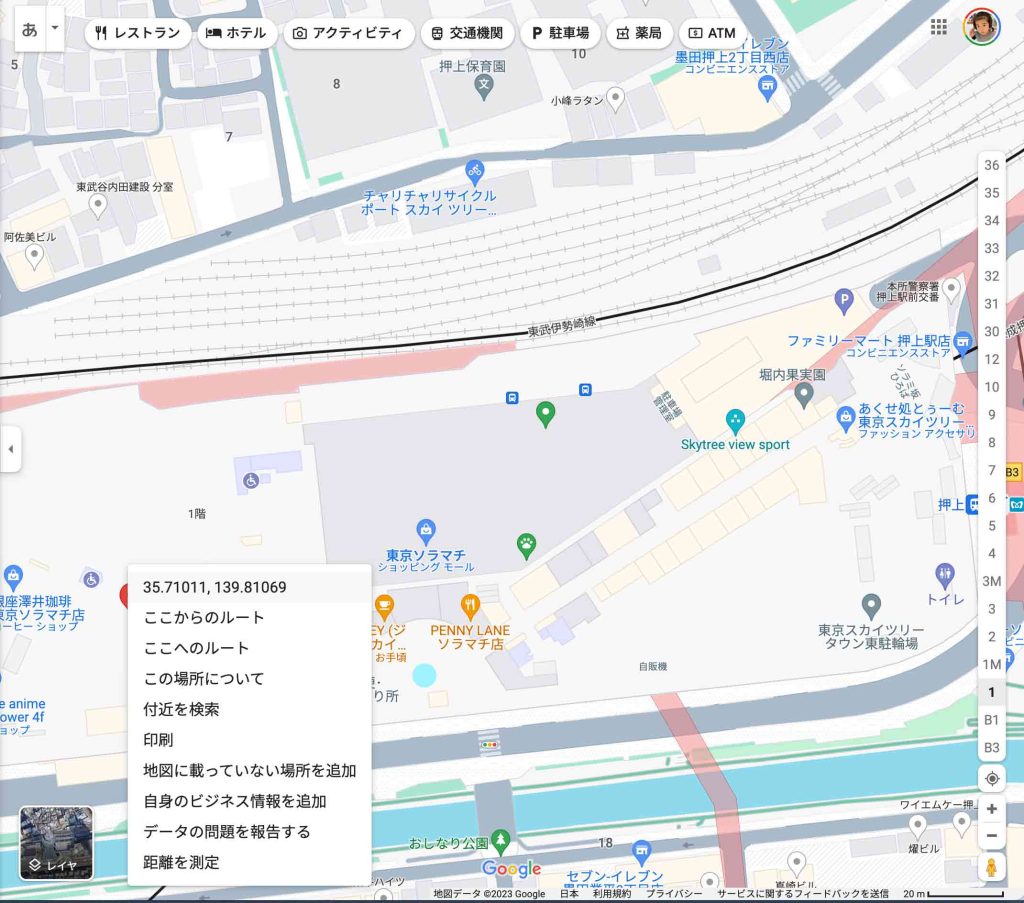
Help Center > Community: Explore the EarthHow images are collected は参考になった。衛星写真や空中写真はモザイク利用がなされており,シームレスに繋げられている,ということだ。このシームレスに繋ぐ技術って,当方は凄いなあ,と思っている。3Dオブジェクトは空中の撮影場所が変われば大きく倒れ込む。これをできるだけ防ぐ技術があるのだ。ちょっと気になって,スカイツリーを見たくなった。
3の文献はナイジェリアでのGoogle Earth(GE)とSRTM(the Shuttle Radar Topography Mission v3.0)の画像の2000〜2018年の比較をしたものである。この期間を4期に分けており,RMSEs (the root mean square errors)の評価をしている。水平精度hotizontal accuracyに注目すると,
In terms of the horizontal accuracy, the root mean square errors (RMSEs) are as follows – year 2000 (29.369m), year 2008 (28.391m), year 2012 (10.615m) and year 2018 (10.603m). The most recent GE imagery (year 2018) was the most accurate while year 2000 was the least accurate. This shows a continuous enhancement in the accuracy and reliability of satellite imagery data sources which form the source of Google Earth data.
とあり,GEの精度は年々,改善されていることがわかる。
そのため,古い文献をみても現状を知ることはできないのである。1の文献では地域別の評価がなされており,Southeast and East Asiaが最も精度が低くなっていることはわかるのである。日本がGEにとってどう評価されているのかは不明で,Europe並の精度が提供されているかは不明である。2の文献はナイジェリアでの評価であるが,奇妙に高い精度を示していて,他の評価との間に大きな懸隔がある。
ABSTRACT: Since the release of Google Earth image data, it has been the most widely used remote sensing data worldwide, and its accuracy evaluation has also been the focus of historical research. However, the researchers found that Google Earth’s image accuracy assessment results have obvious regional characteristics. This article uses the Australian continent as the research area and WorldView-2 remote sensing images as reference data to study the accuracy evaluation results of Google Earth data. The research shows that the overall accuracy of the assessment area in Australia is better. The areas with the best overall accuracy appear in the western coastal areas, with an accuracy range of 0.7-1.4; the accuracy assessment results in the central desert area are also better, with the accuracy range 1.4-2.2, and the areas with the worst accuracy appear in the western mountains and hills of 14.5 and17.1.