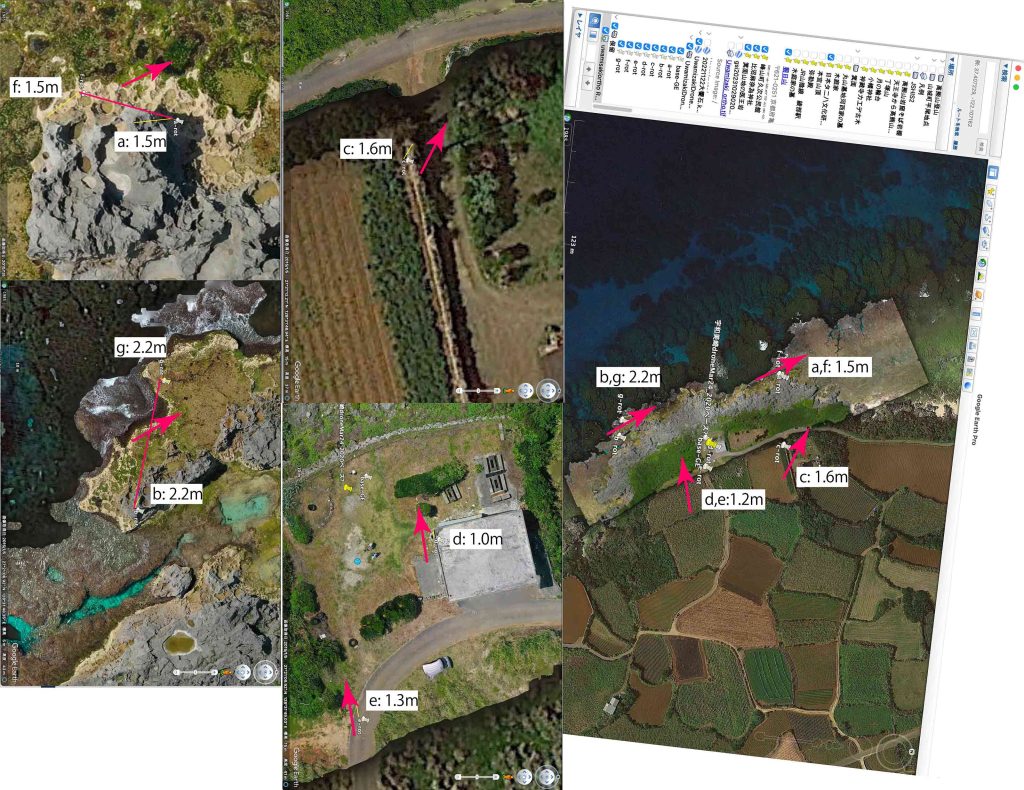
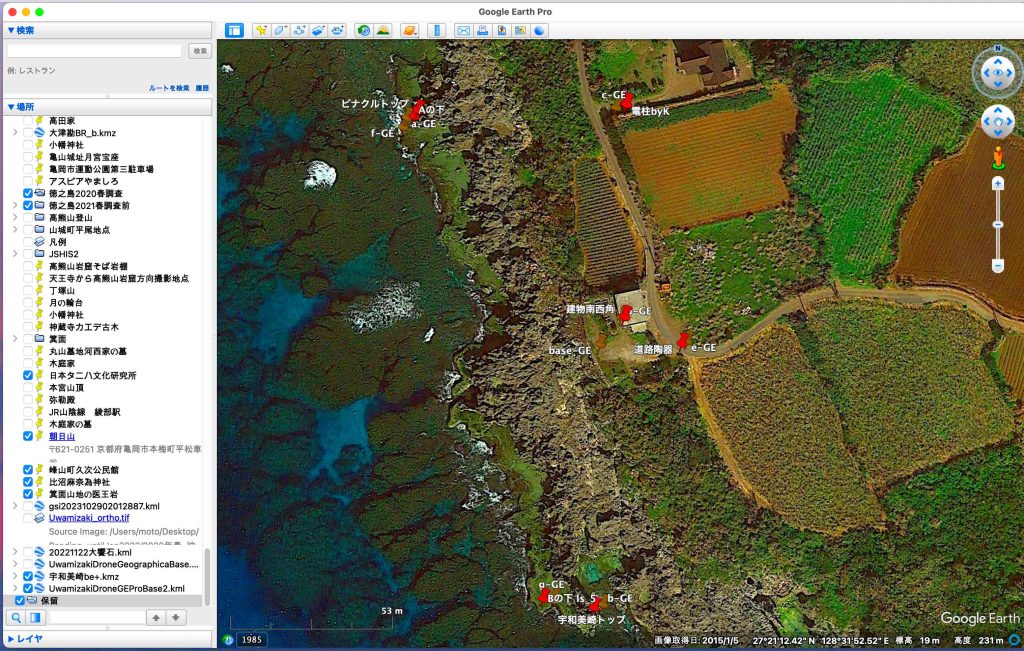
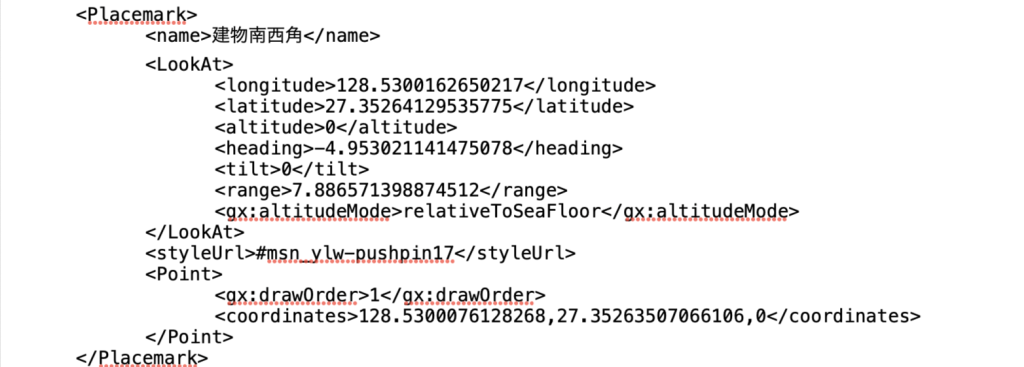
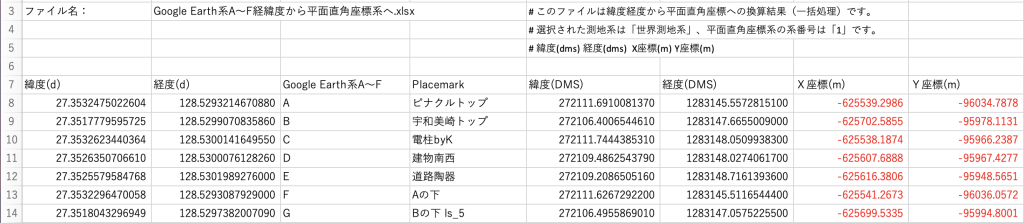
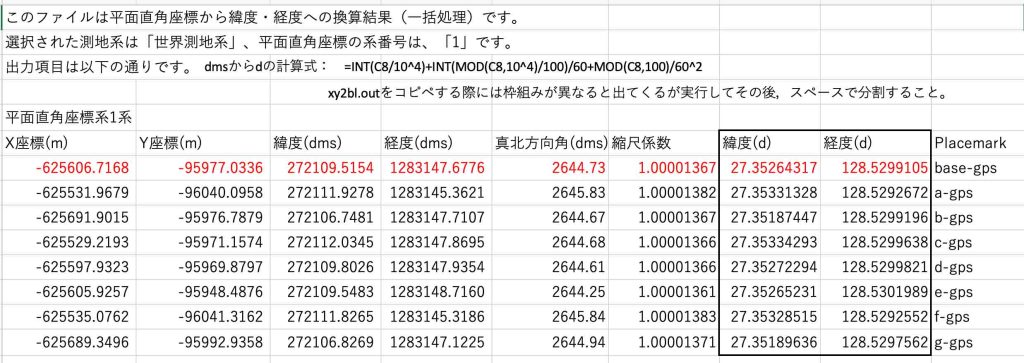
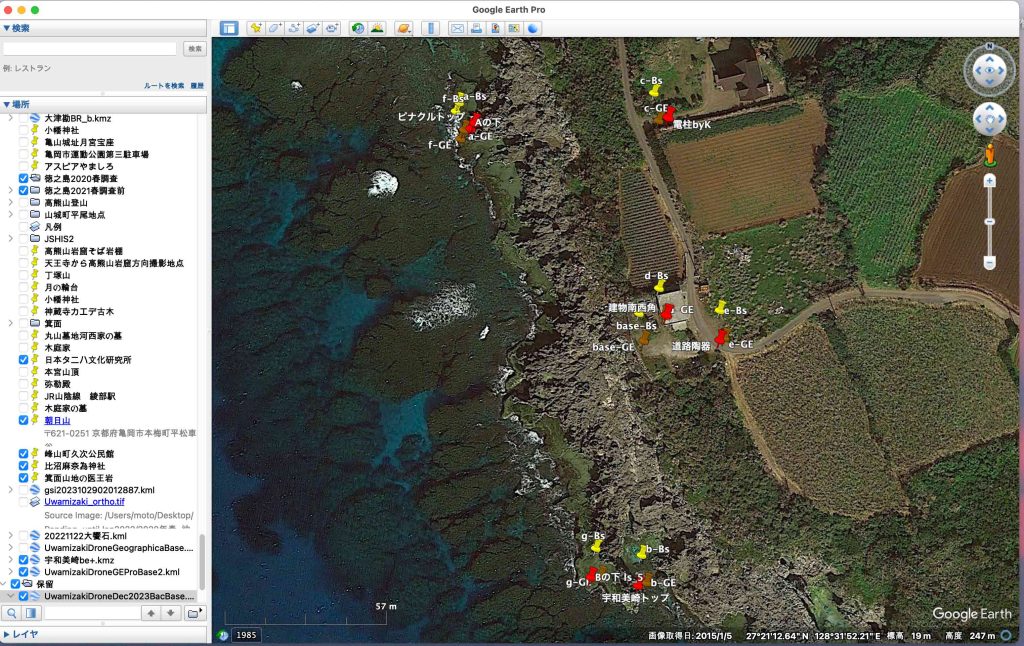
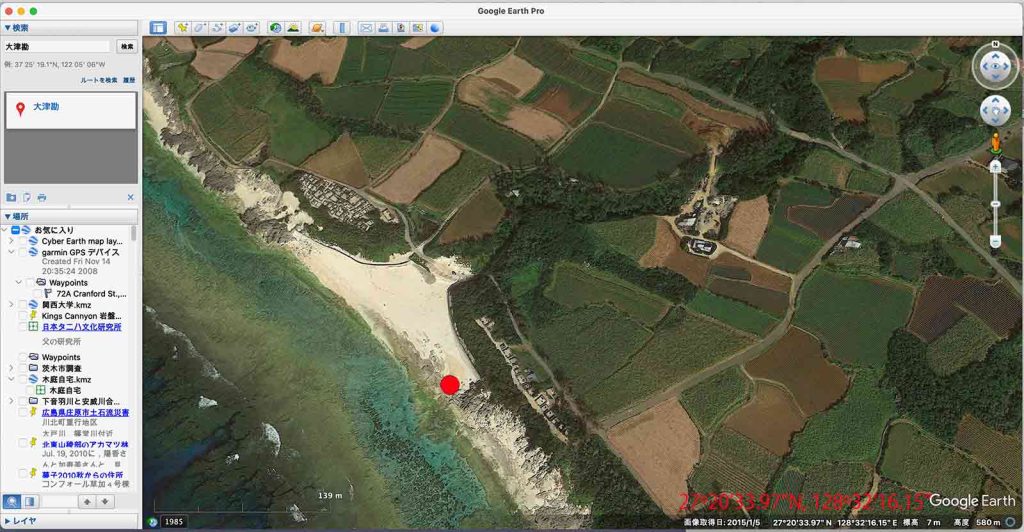
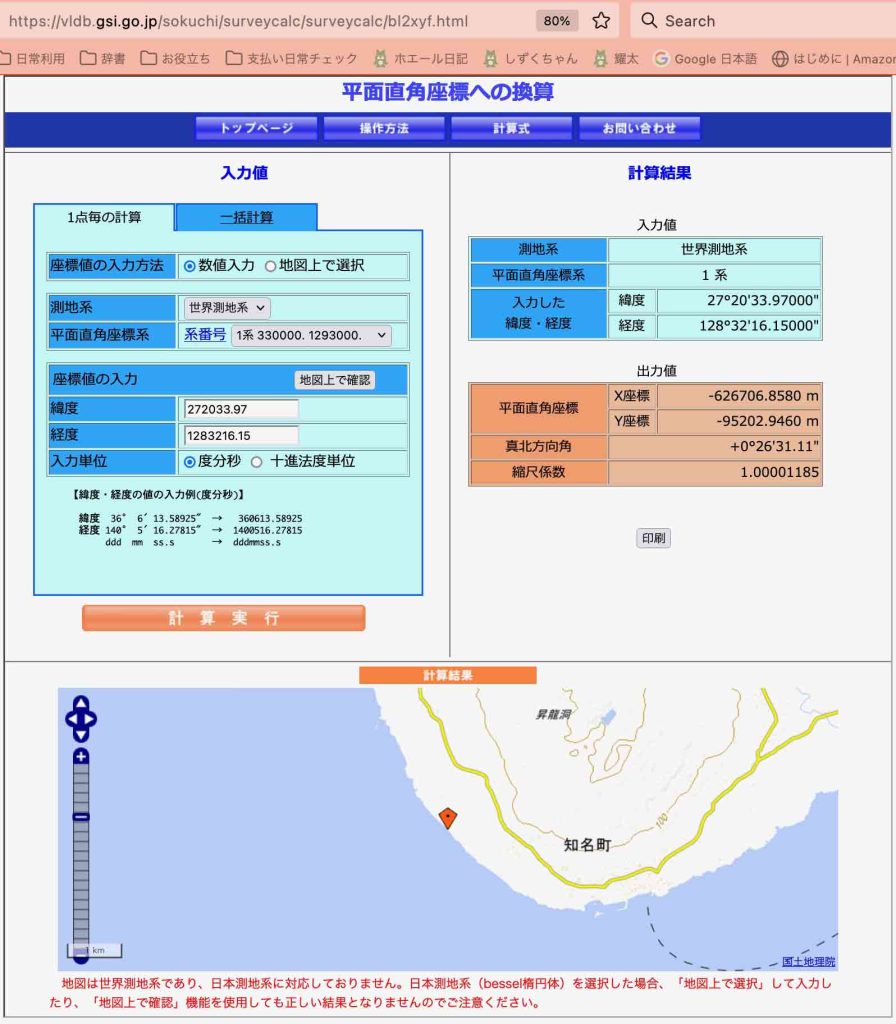
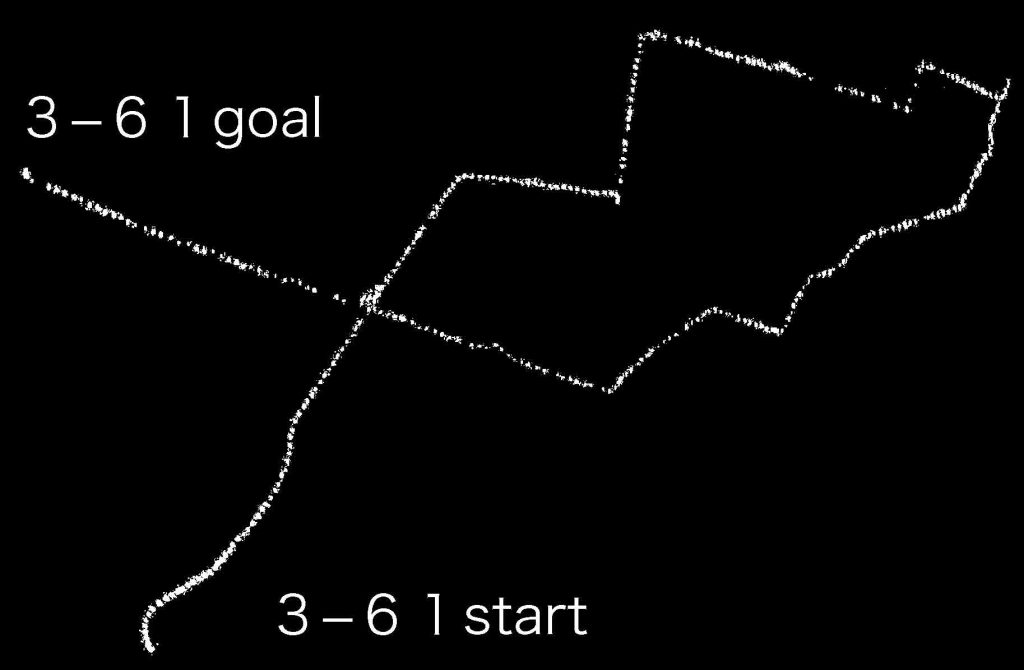
光波測量結果とグーグルアース画像とを平面座標系で補正する試み aim for suitability correction btw electro-optical distance measurements and Google Earth’s images using the coordinate plane
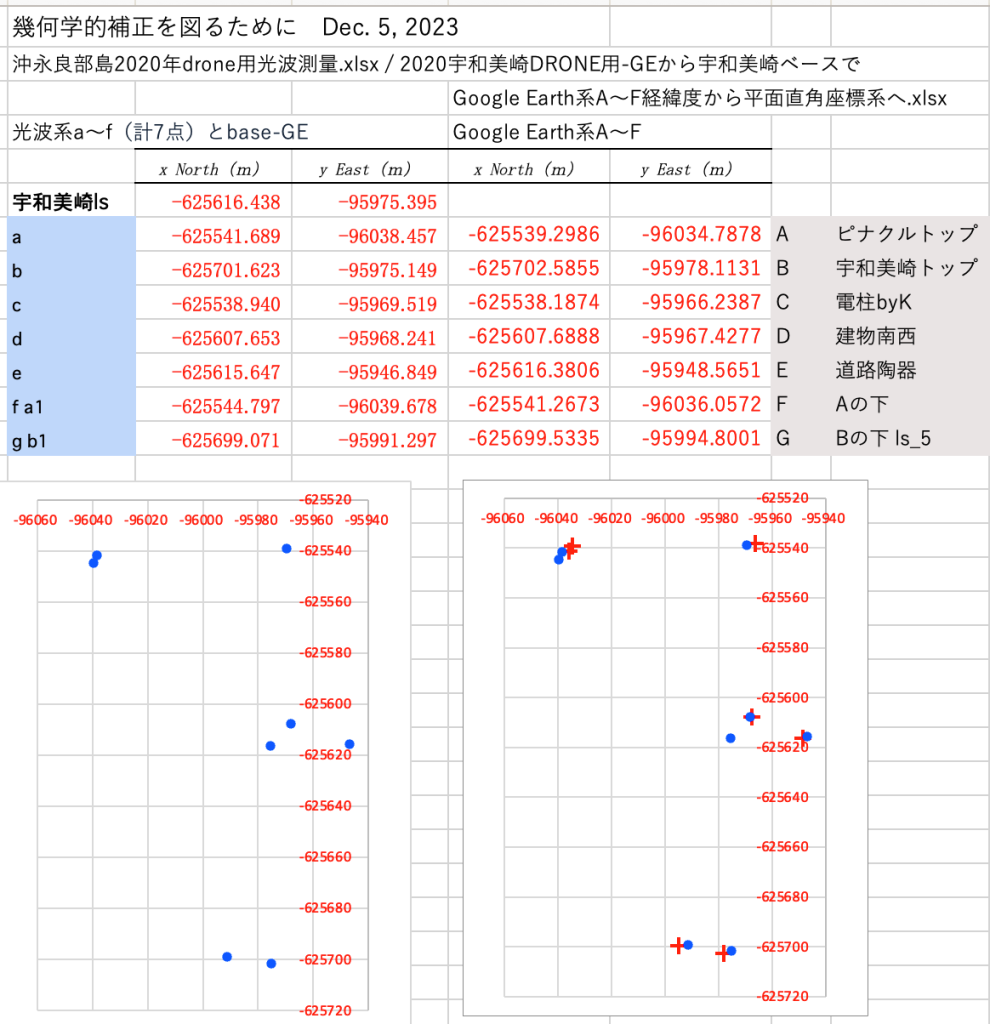
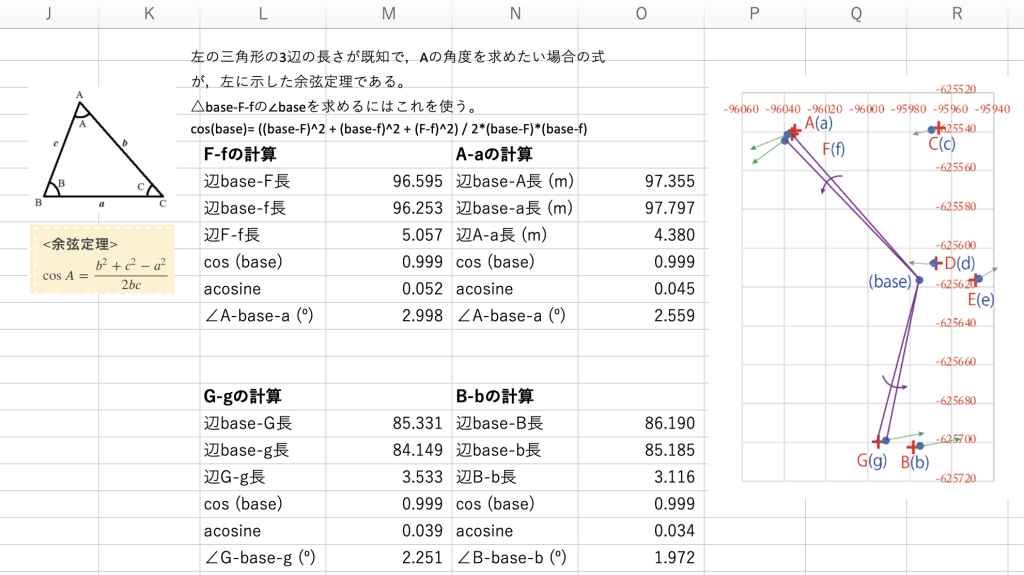
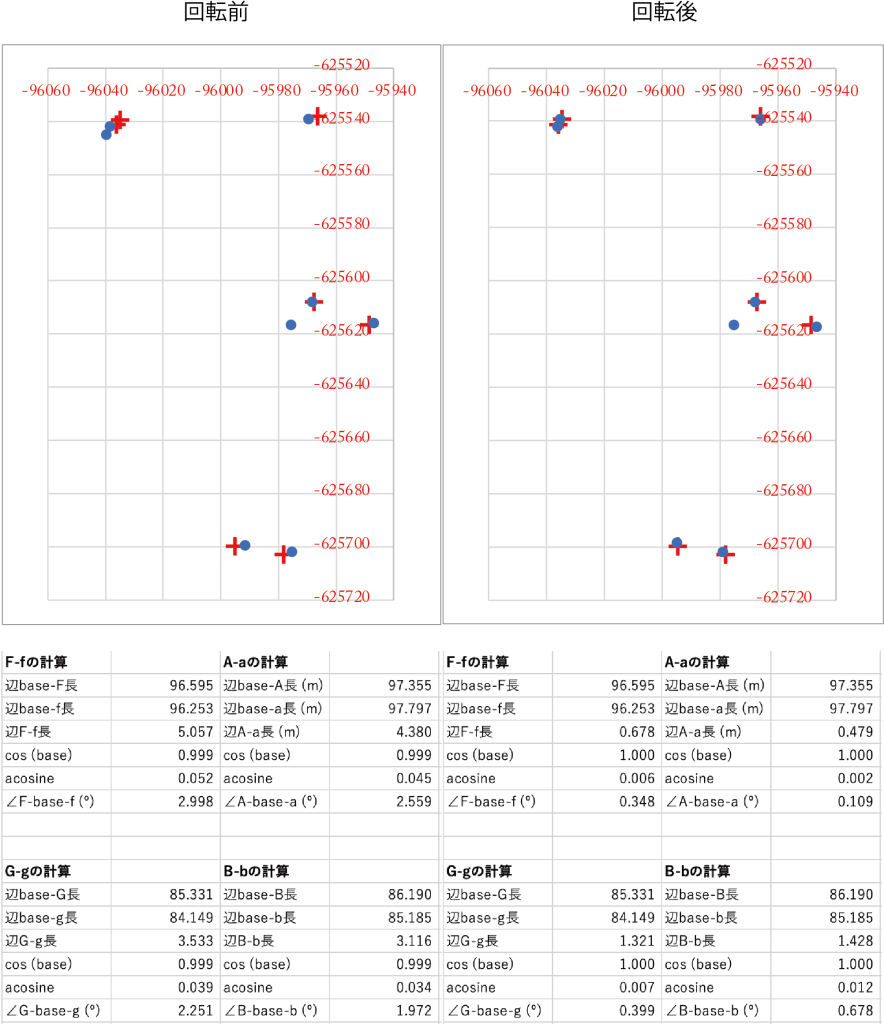
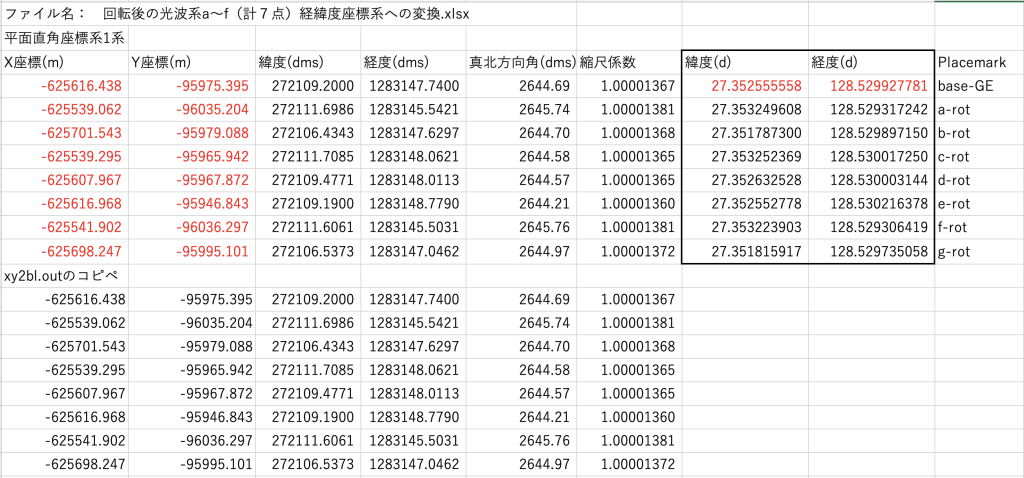
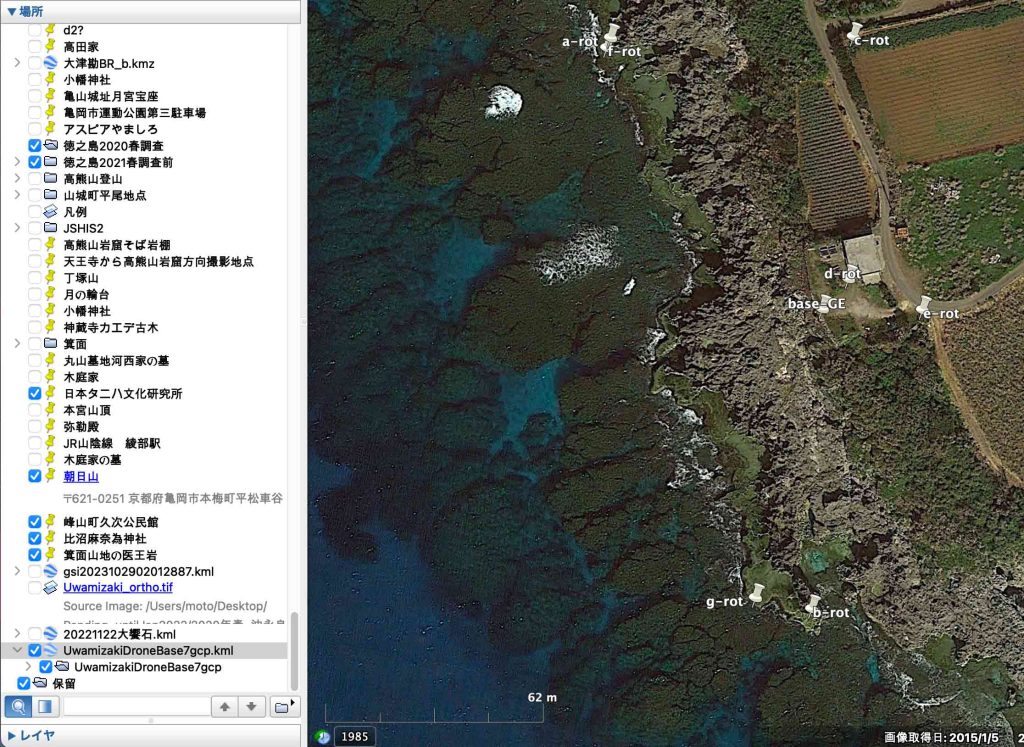
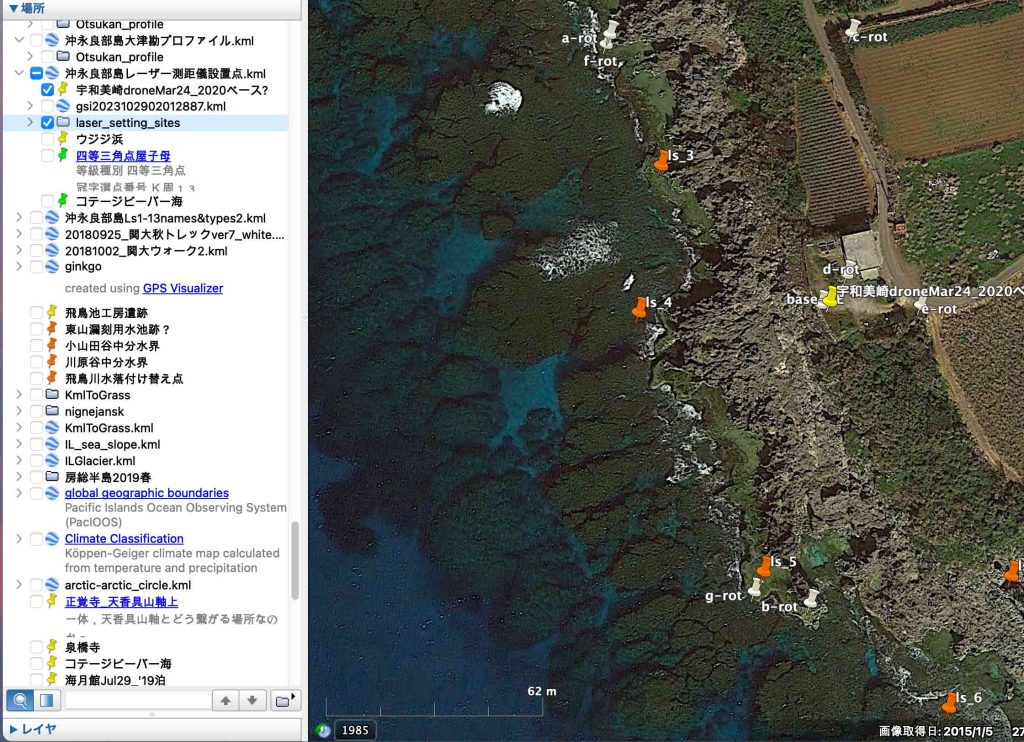
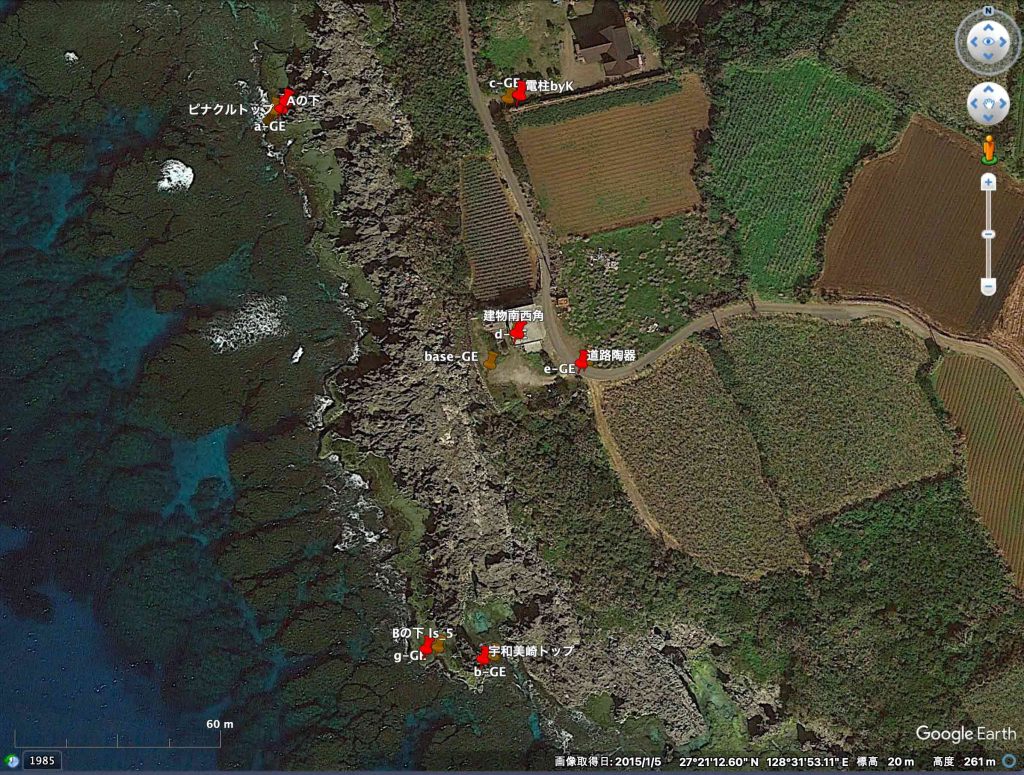
Google Earth系A〜F(計7点)は固定点である。光波系a〜f(計7点)とbase-GE(計8点)は修正が可能である。base-GEを移動すると,光波系a〜f(計7点)も計算式に従って,変わる。iterationの手法を使えば,北西部分と南東部分の各2点の誤差角度の平均値を揃えることは可能である。(base)を最大2mほどだろうか南方に移動すれば一致する筈である。
HI Arun, For some reason, your post just showed up in the Google Earth forum today, May 12. The digital elevation model used for most of the earth is from the SRTM recorded in February 2020. It’s a general survey and not specifically accurate by any standard. It simply happens to be the only digital elevation data that covers most of the earth. In the US, elevation data points are 30 meters apart and everything in between is interpolated. In other areas, the points may be 90 meters apart. The Jet Propulsion Lab will only guarantee accuracy of the data points as +/- 16 meters 95 % of the time.
There’s no documentation of how the elevation profile works. Over the years, it has had various glaring errors. You can’t use it for the level of accuracy you’re looking for.
I know that doesn’t help but it’s the situation that exists.
上記中の精度の記述で注目されるのは,赤字の部分だ。only guarantee accuracy of the data points as +/- 16 meters 95 % of the time これには驚いたし,なるほどと納得された。
さらに,他の技術者が回答している。
Alchemist251 Diamond Product Expert May 14, 2021
Arun, the ruler path tool doesn’t consider elevation change. This is in line with how surveyors measure property. So, if a piece of property contains a cliff, you get the face of the cliff for free. That doesn’t help hikers much, I know.
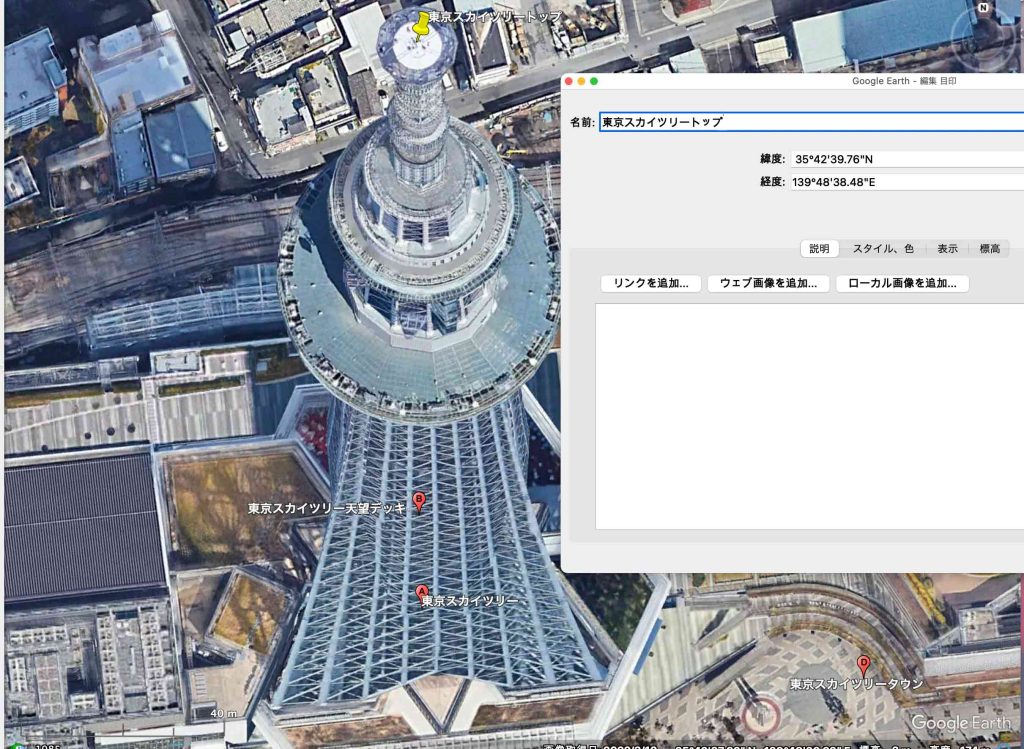
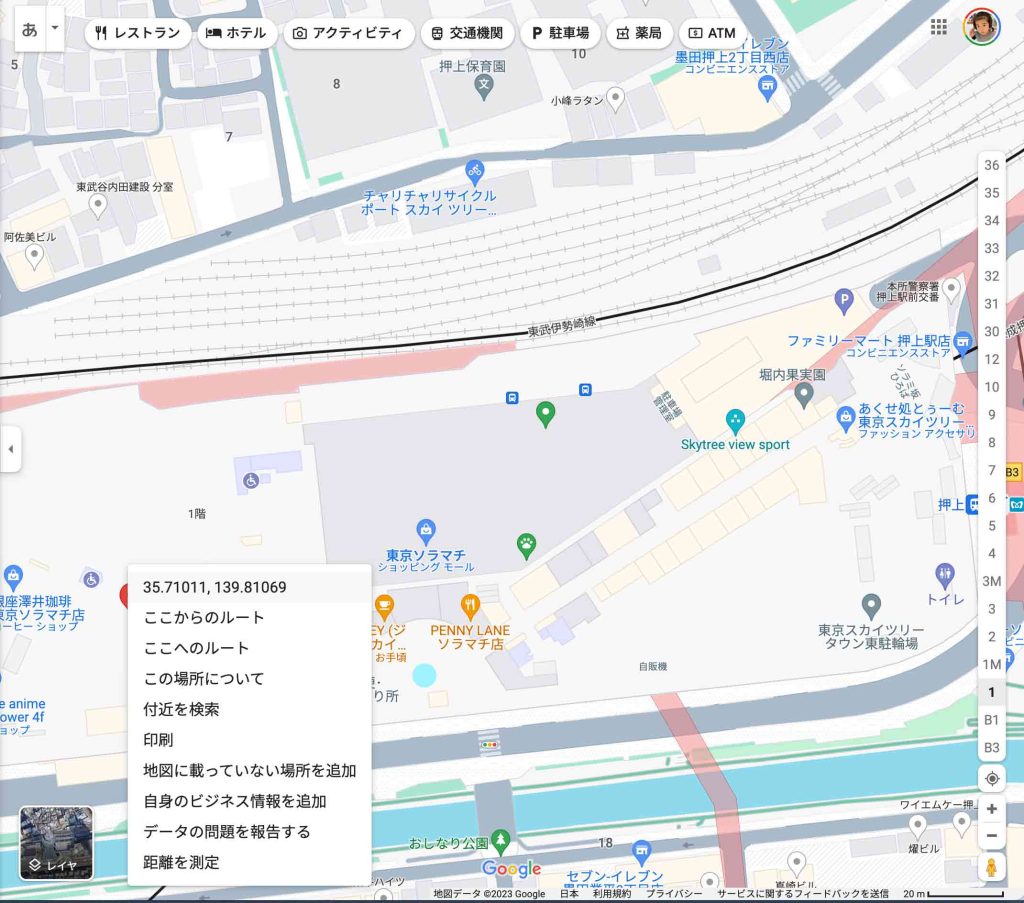
Help Center > Community: Explore the EarthHow images are collected は参考になった。衛星写真や空中写真はモザイク利用がなされており,シームレスに繋げられている,ということだ。このシームレスに繋ぐ技術って,当方は凄いなあ,と思っている。3Dオブジェクトは空中の撮影場所が変われば大きく倒れ込む。これをできるだけ防ぐ技術があるのだ。ちょっと気になって,スカイツリーを見たくなった。
3の文献はナイジェリアでのGoogle Earth(GE)とSRTM(the Shuttle Radar Topography Mission v3.0)の画像の2000〜2018年の比較をしたものである。この期間を4期に分けており,RMSEs (the root mean square errors)の評価をしている。水平精度hotizontal accuracyに注目すると,
In terms of the horizontal accuracy, the root mean square errors (RMSEs) are as follows – year 2000 (29.369m), year 2008 (28.391m), year 2012 (10.615m) and year 2018 (10.603m). The most recent GE imagery (year 2018) was the most accurate while year 2000 was the least accurate. This shows a continuous enhancement in the accuracy and reliability of satellite imagery data sources which form the source of Google Earth data.
とあり,GEの精度は年々,改善されていることがわかる。
そのため,古い文献をみても現状を知ることはできないのである。1の文献では地域別の評価がなされており,Southeast and East Asiaが最も精度が低くなっていることはわかるのである。日本がGEにとってどう評価されているのかは不明で,Europe並の精度が提供されているかは不明である。2の文献はナイジェリアでの評価であるが,奇妙に高い精度を示していて,他の評価との間に大きな懸隔がある。
ABSTRACT: Since the release of Google Earth image data, it has been the most widely used remote sensing data worldwide, and its accuracy evaluation has also been the focus of historical research. However, the researchers found that Google Earth’s image accuracy assessment results have obvious regional characteristics. This article uses the Australian continent as the research area and WorldView-2 remote sensing images as reference data to study the accuracy evaluation results of Google Earth data. The research shows that the overall accuracy of the assessment area in Australia is better. The areas with the best overall accuracy appear in the western coastal areas, with an accuracy range of 0.7-1.4; the accuracy assessment results in the central desert area are also better, with the accuracy range 1.4-2.2, and the areas with the worst accuracy appear in the western mountains and hills of 14.5 and17.1.
光波測距儀設置点をGEPro情報から捉える:後方交会法 acquisition of setting point of an electro-optical distance measuring instrument using GEPro images by the backward intersection method
はじめに
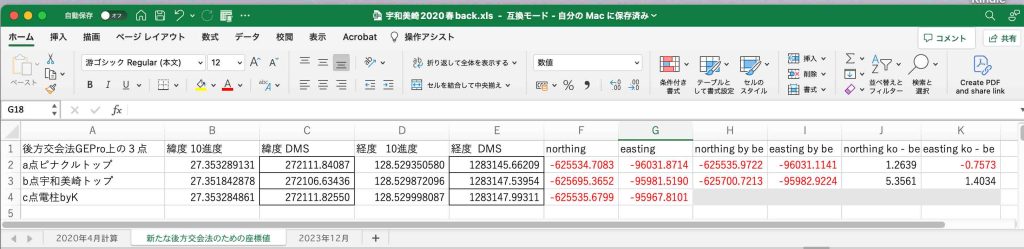
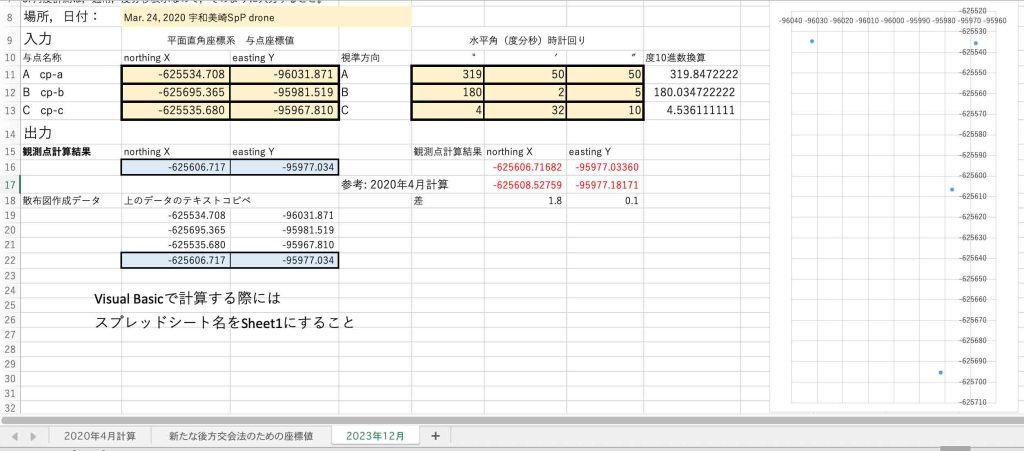
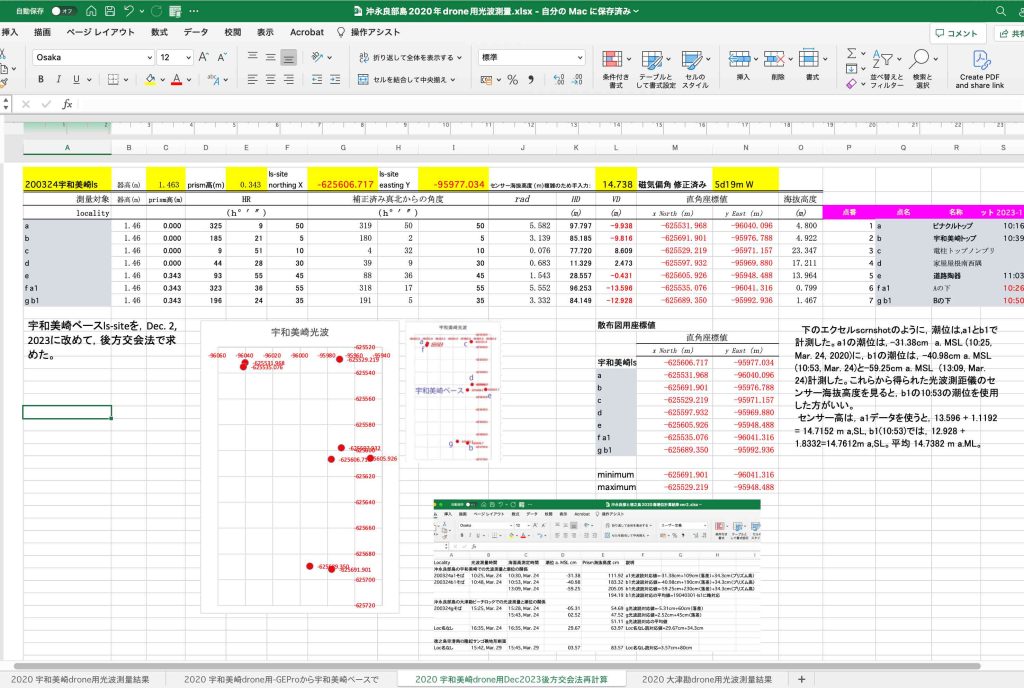
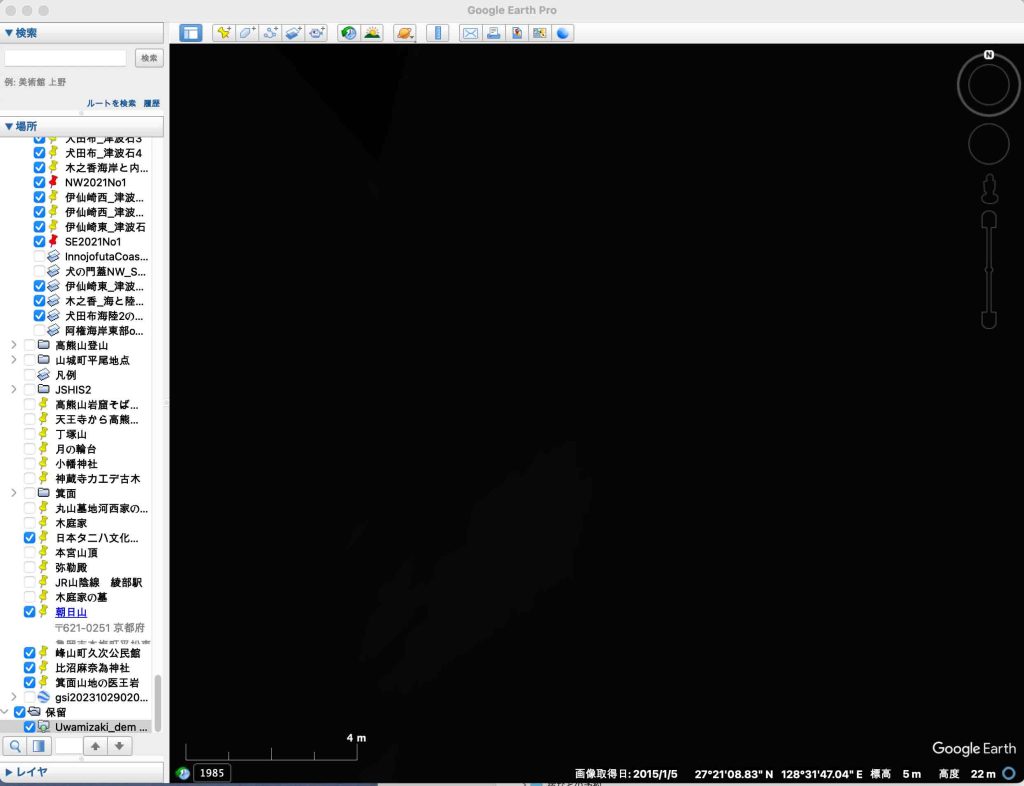
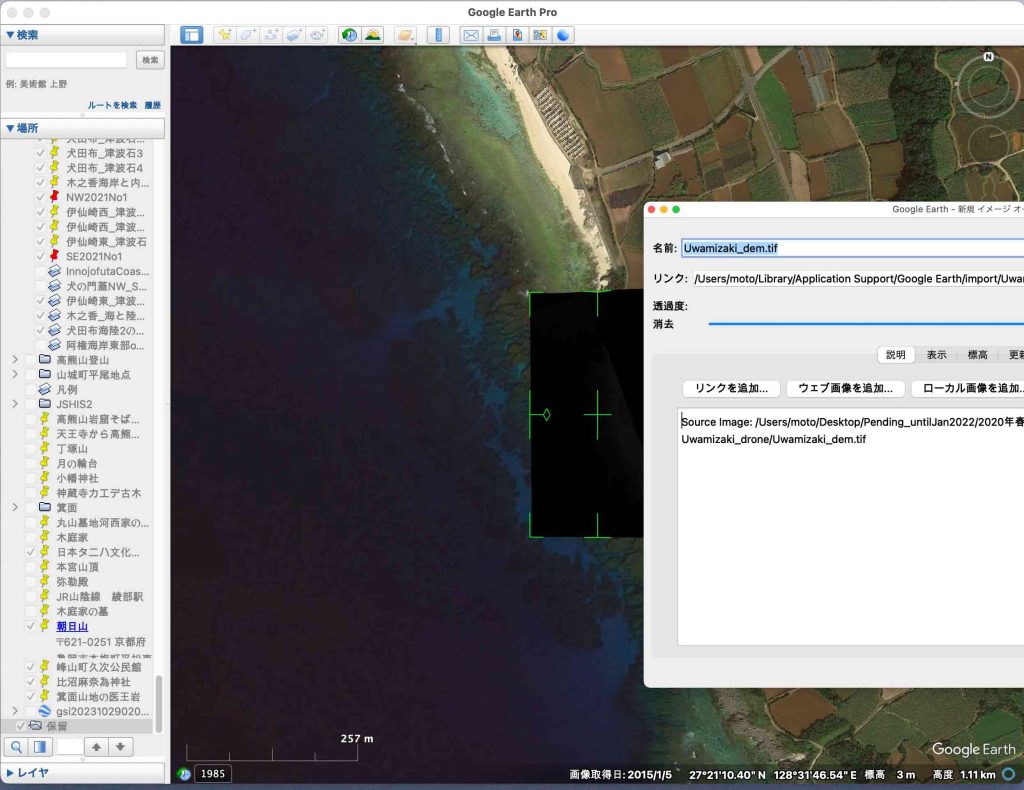
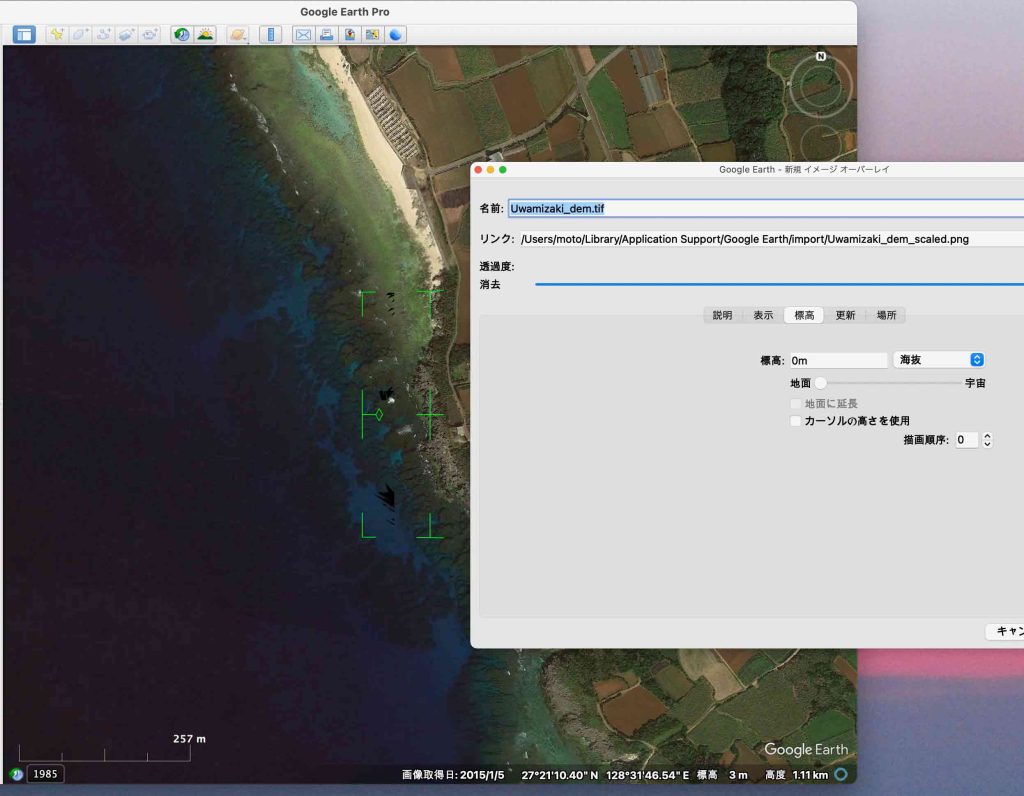
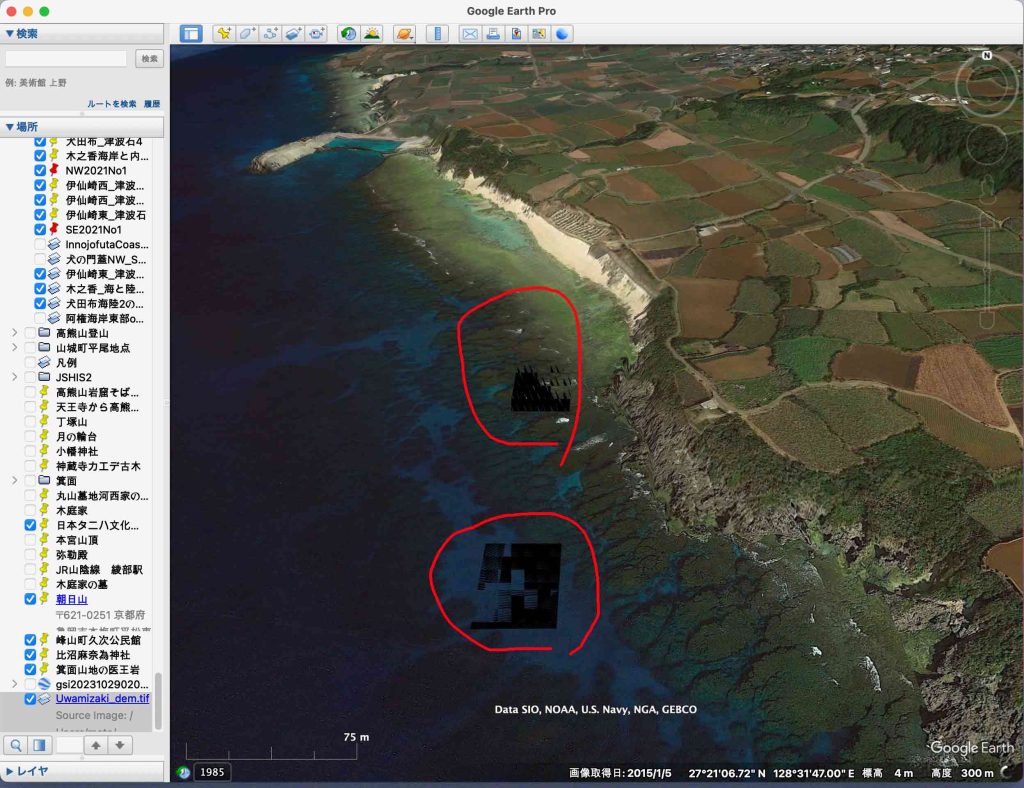
drone測量の際に公共基準点を利用できない事態が生じた。drone測量の経験が不足していた結果であった。drone測量で得られた空中写真と現地情報とを繋ぐために,1点にのみ設置した光波測距儀から得られた7点のgcpについて,drone測量から得られた空中写真上で同定した。以上の結果だけでは地球座標系との関係が得られず,光波設置点を後方交会法で求めた。(Nov. 2023にはこのことを失念していて,光波測距儀設置点をiPhone 12 ProのGPS計測値としていた)。2020年の調査から帰ってearly April, 2020には,drone測量結果からDEMやortho.tif画像を得たのであるが,Nov., 2023に検証してみると,GEProの画像とかなり一致していないことがわかり,このページ作成時には,GPSの精度の問題と誤解していた。
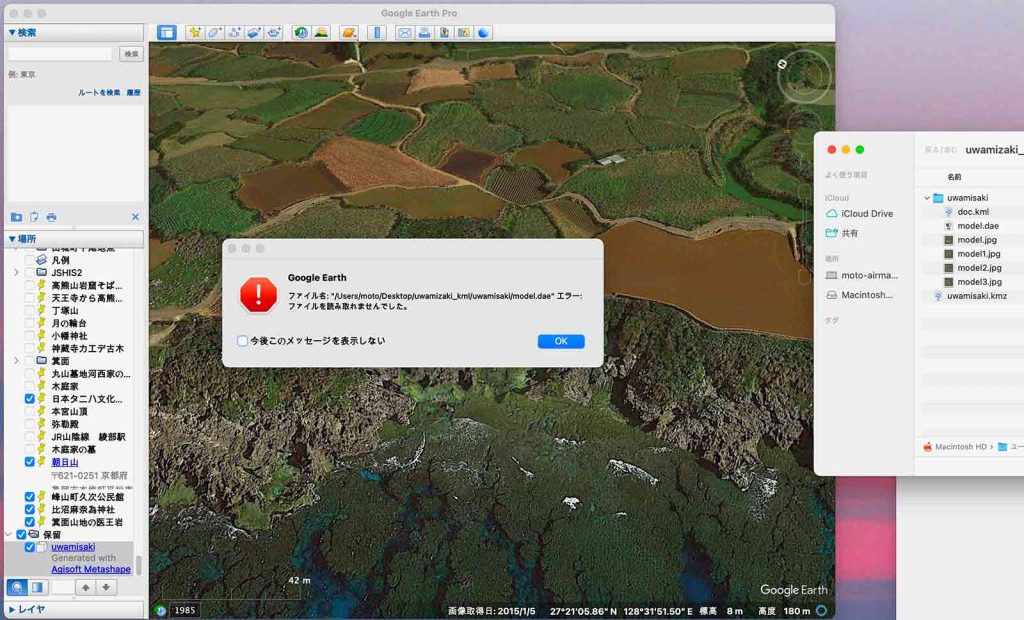
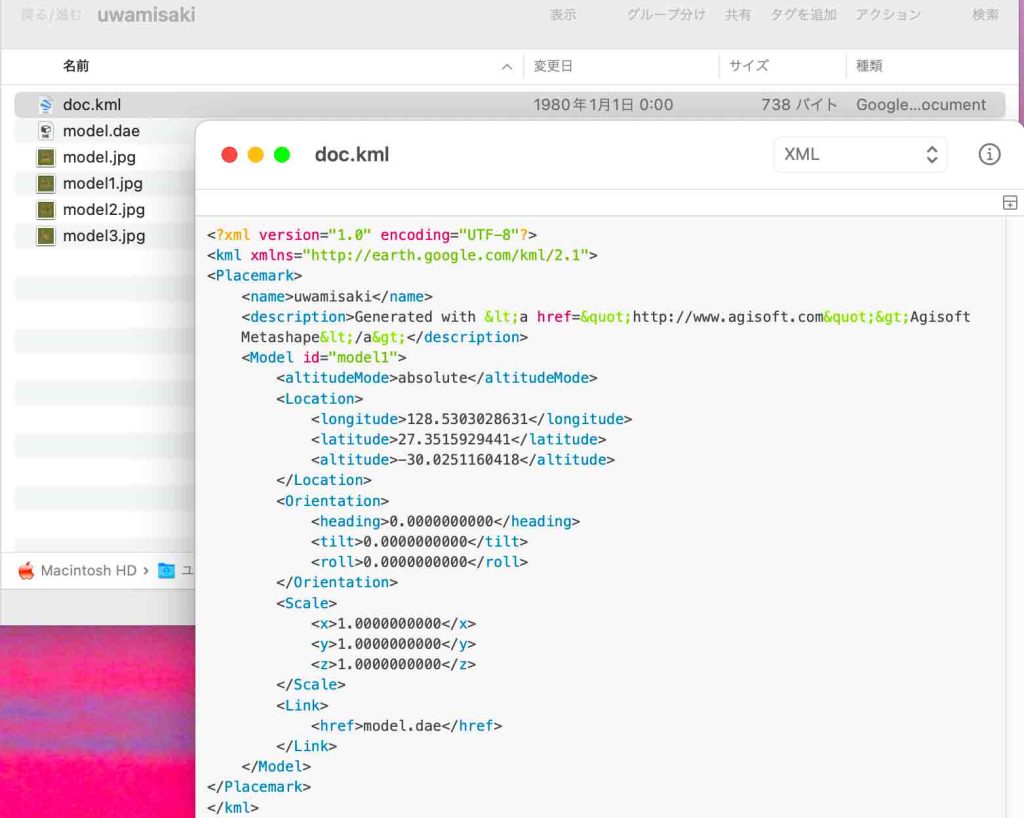
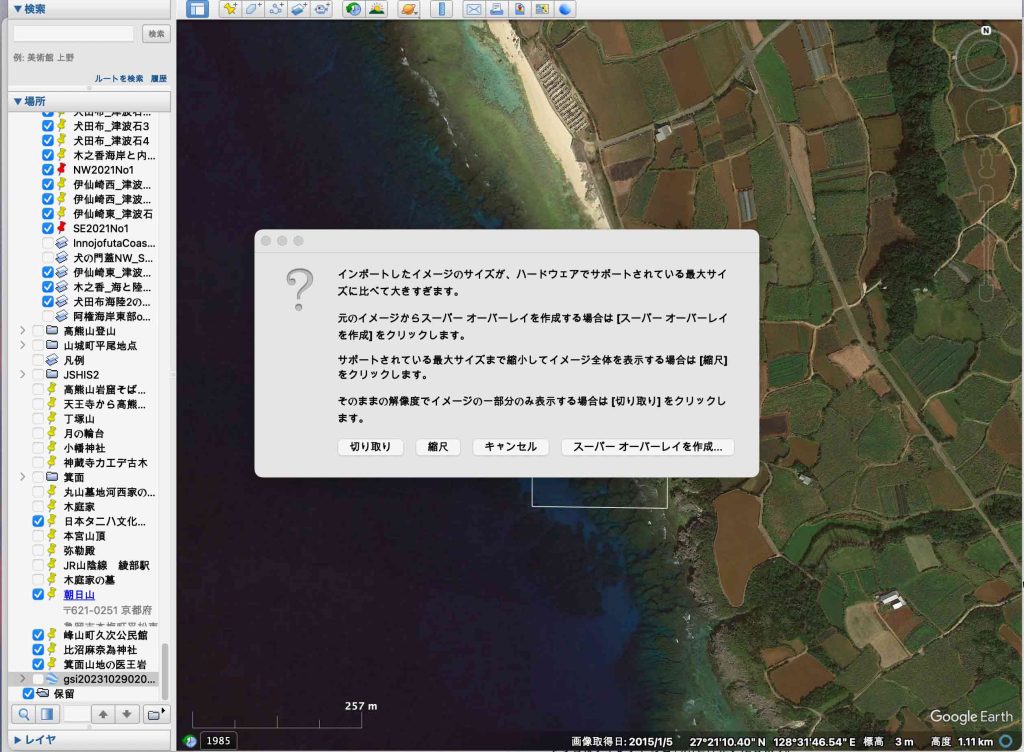
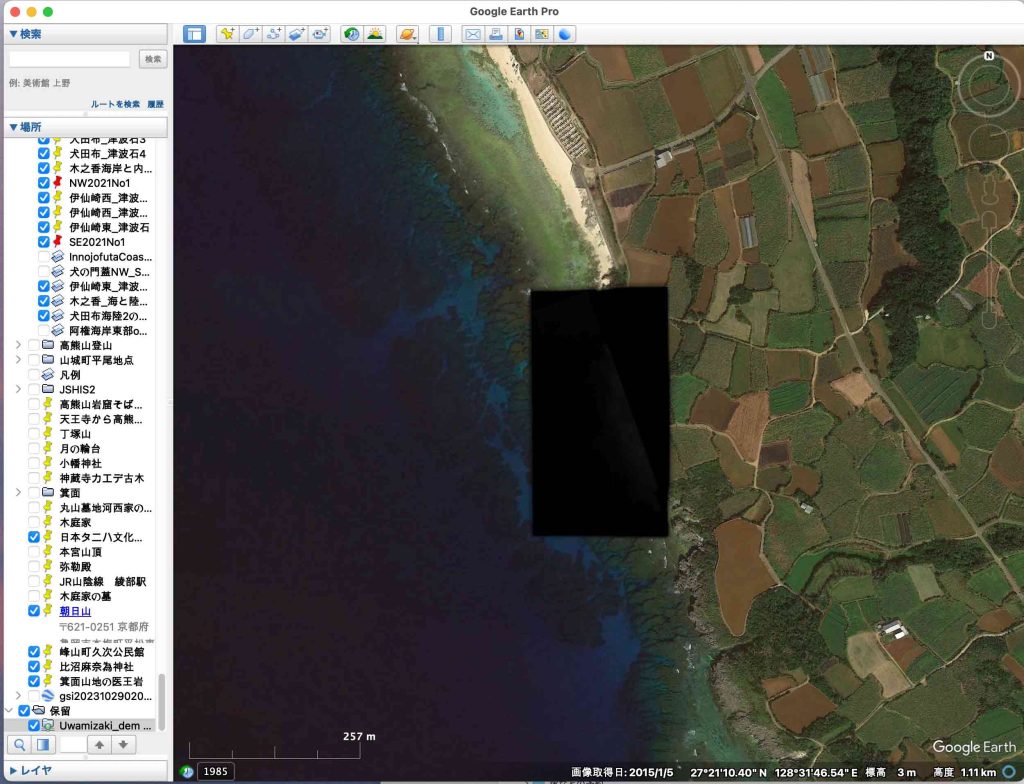
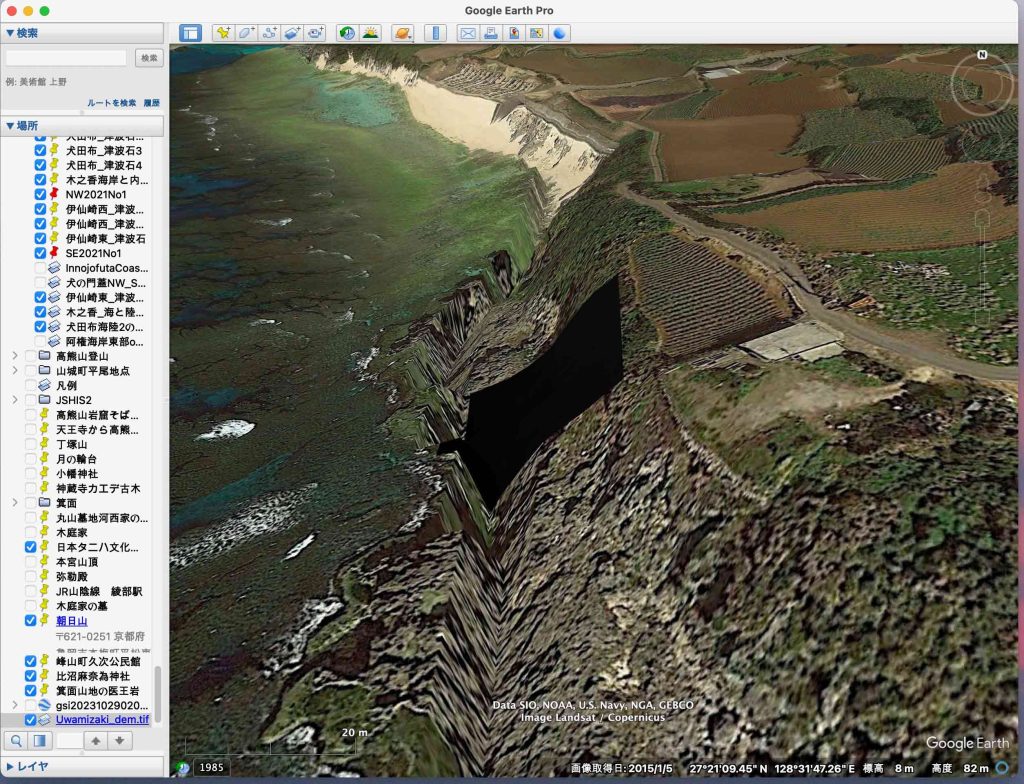
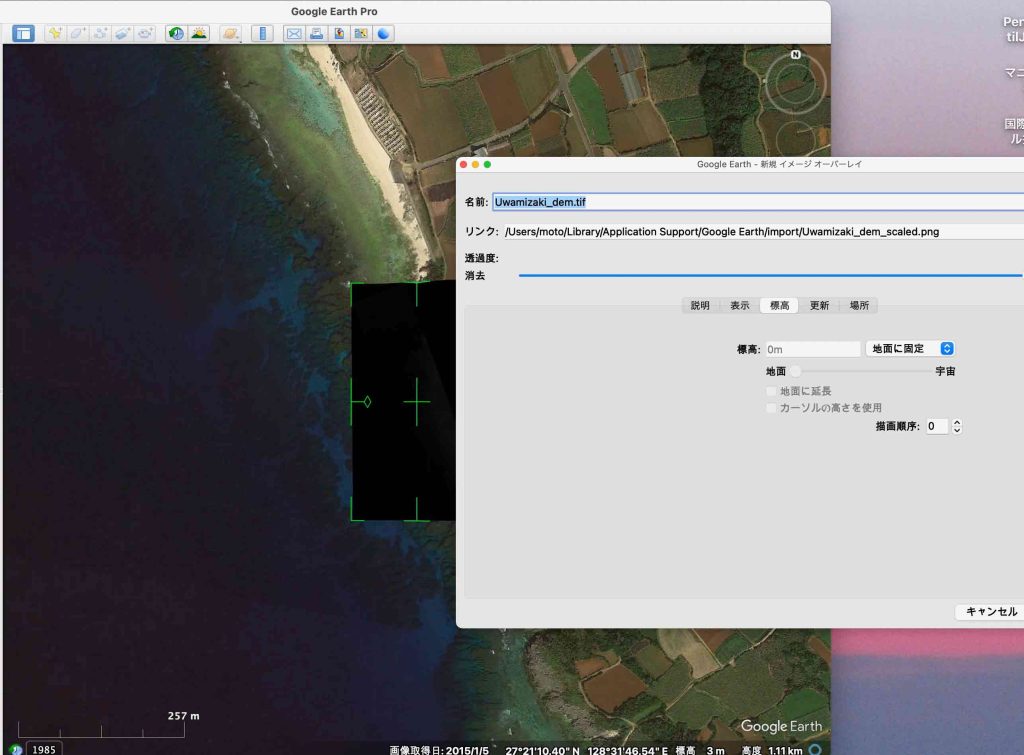
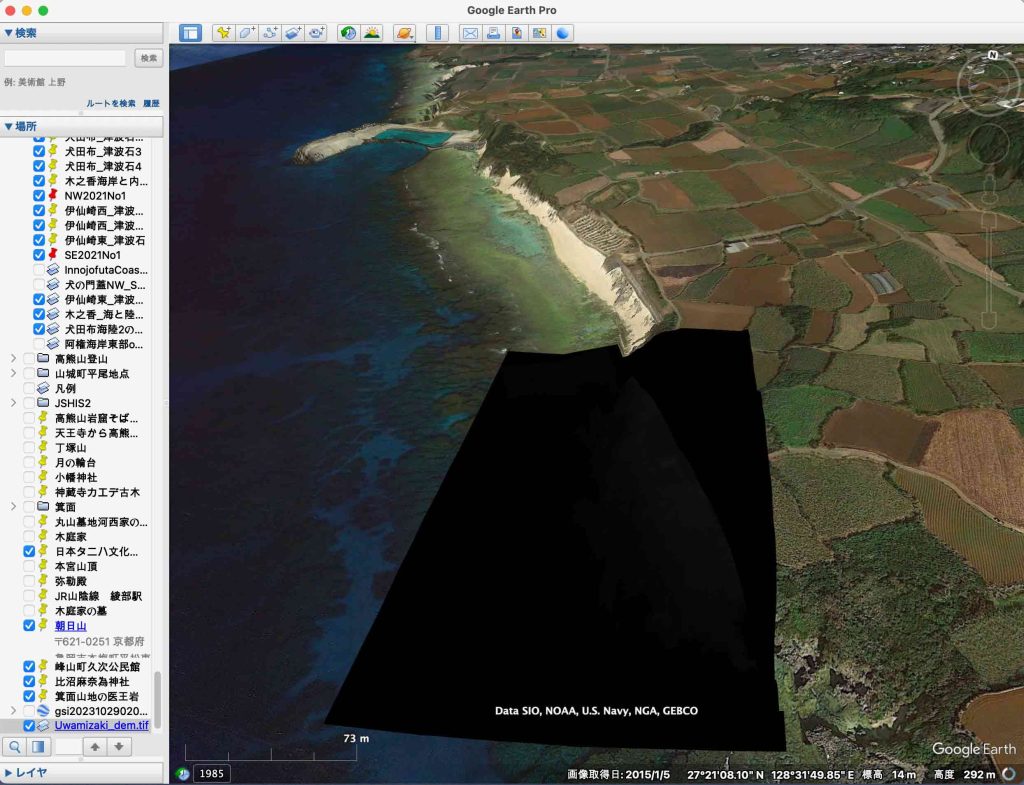
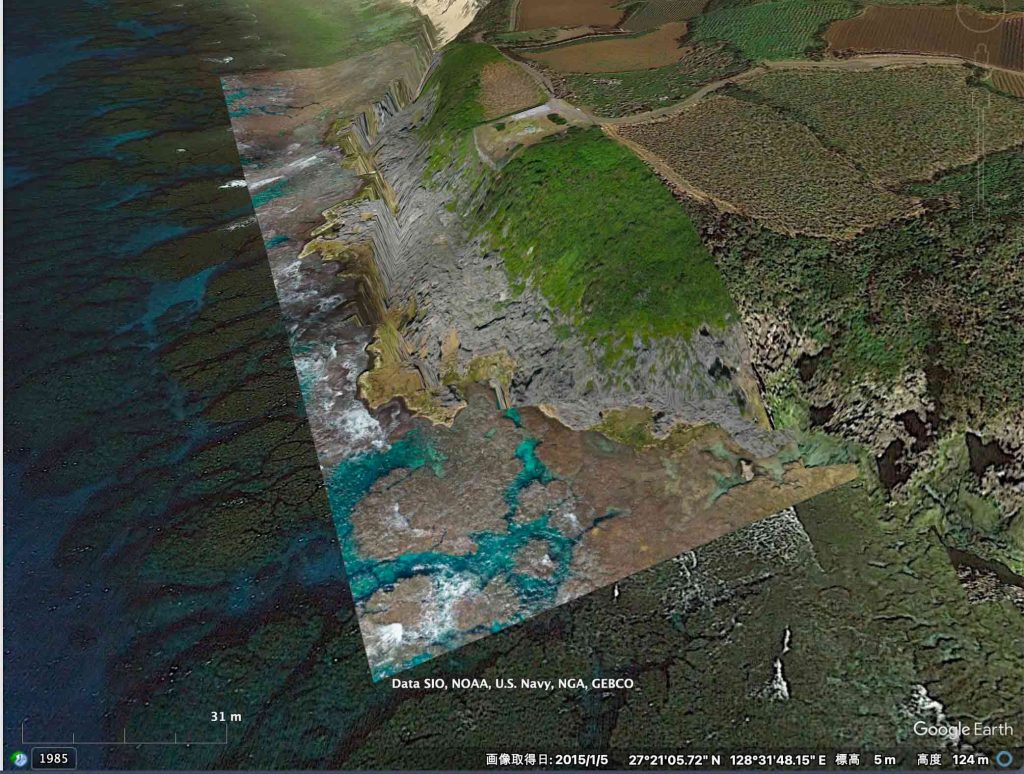
It would also be theoretically possible to generate a COLLADA model of the terrain from your DEM and import as a KML , but that couild get pretty involved.
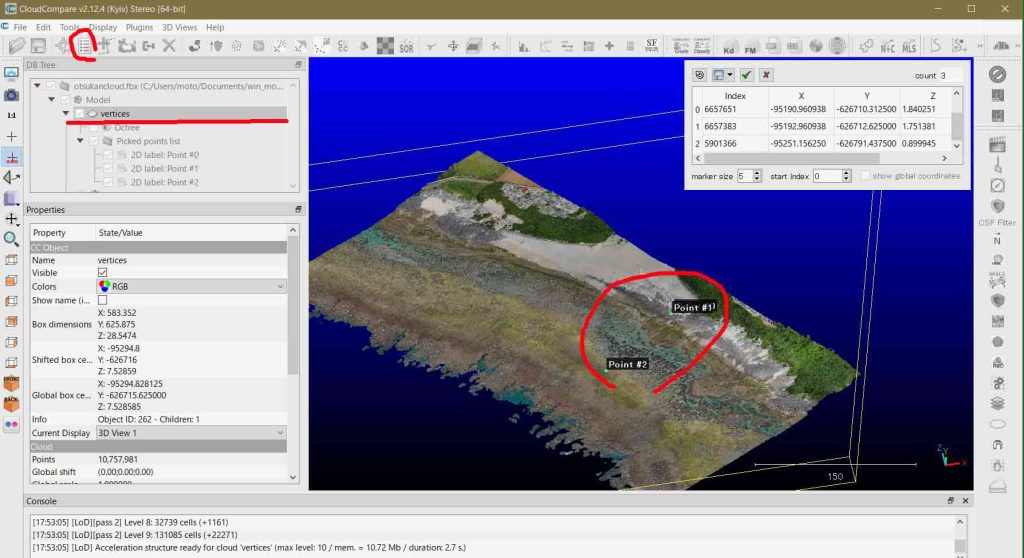
なお,気になるところがあって,図3のPoint 2のZ値が,0.899945 mとなっていて,中等潮位から1m近く高くなっている。ドローンデータの整理で使用したCP control points情報を確認する必要がある。 連絡掲示板 > 2 Trials and tribulations on 3D contents 1.3 個別的な確認:沖永良部島大津勘ビーチロック海岸,の方で議論する。
以上,Oct. 27, 2023記。
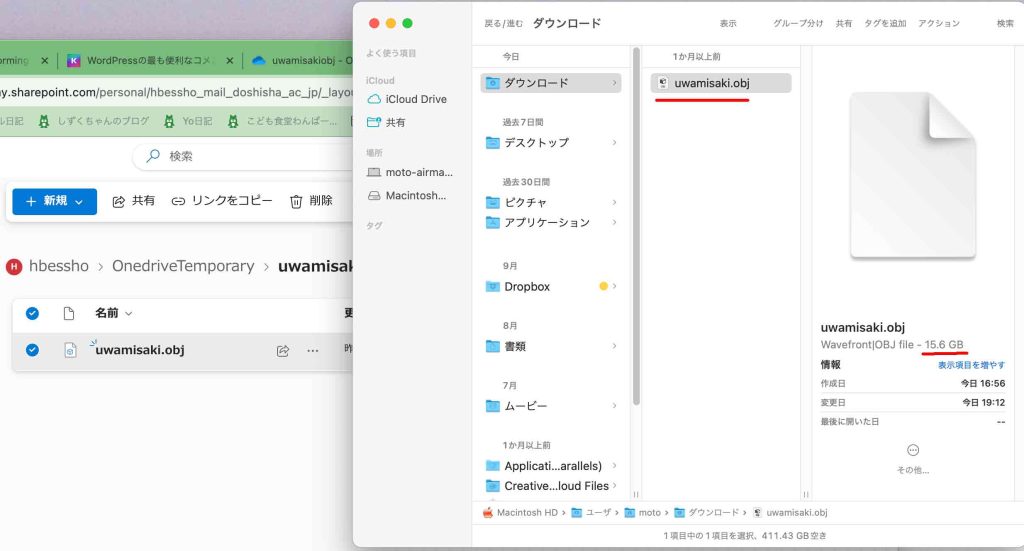
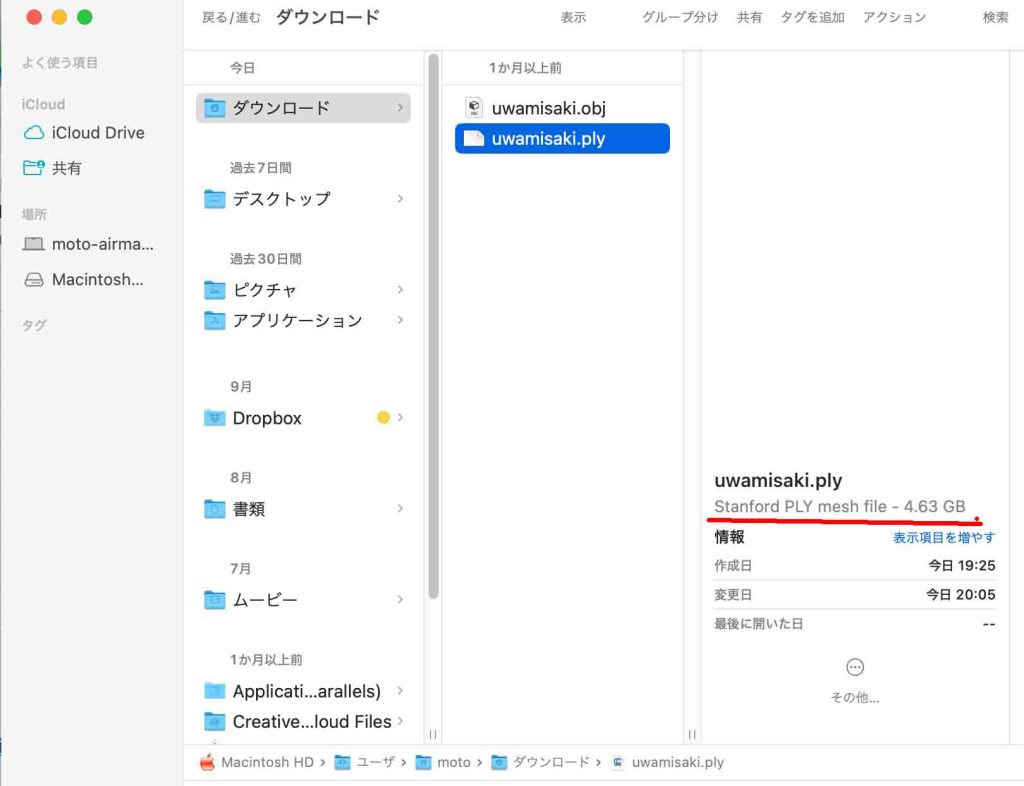
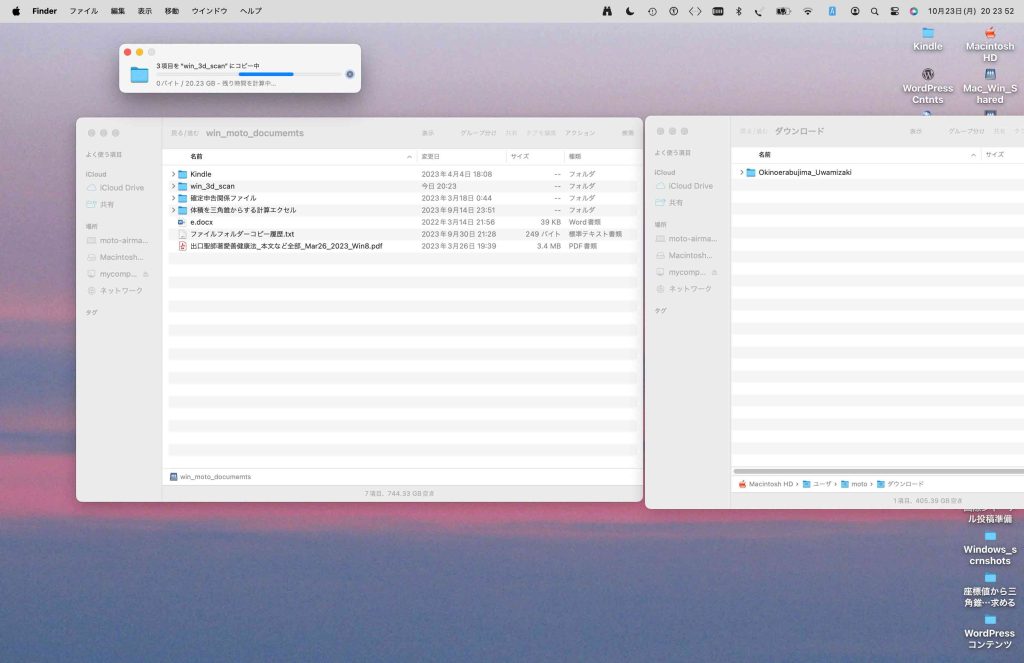
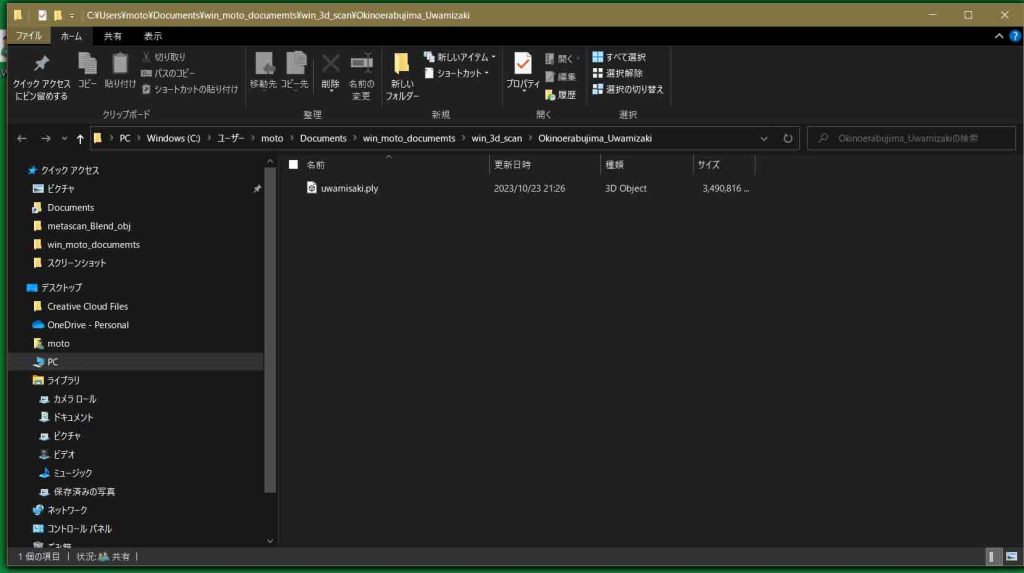
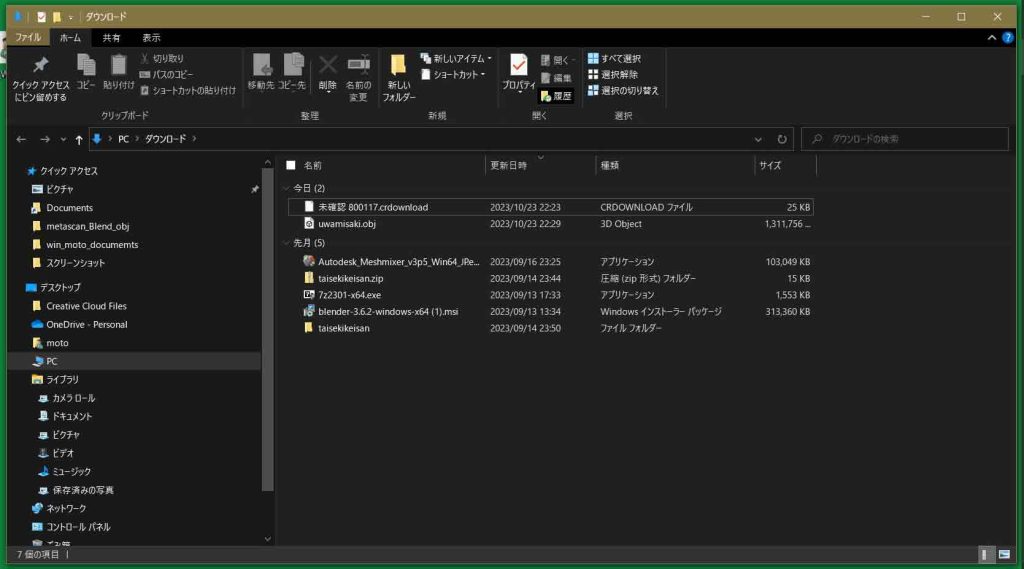
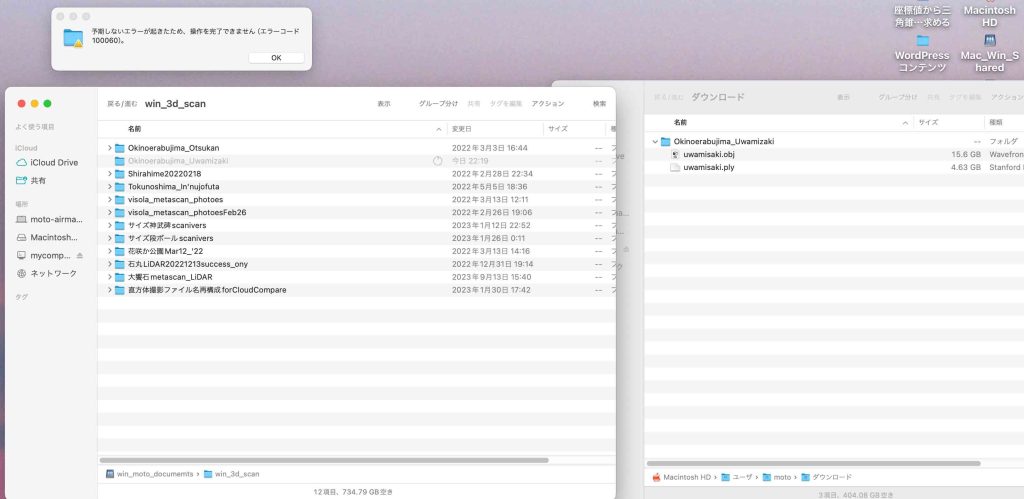
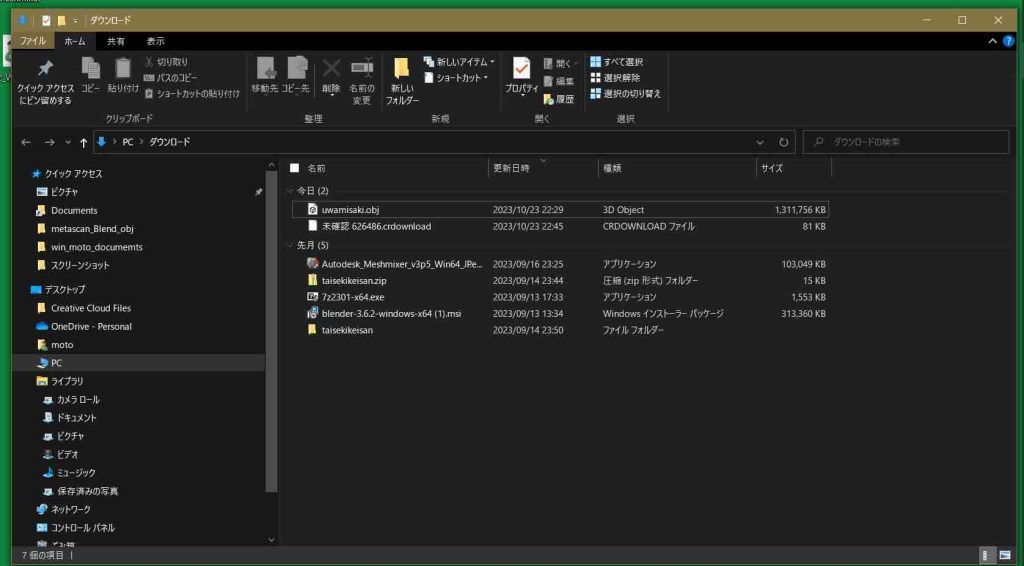
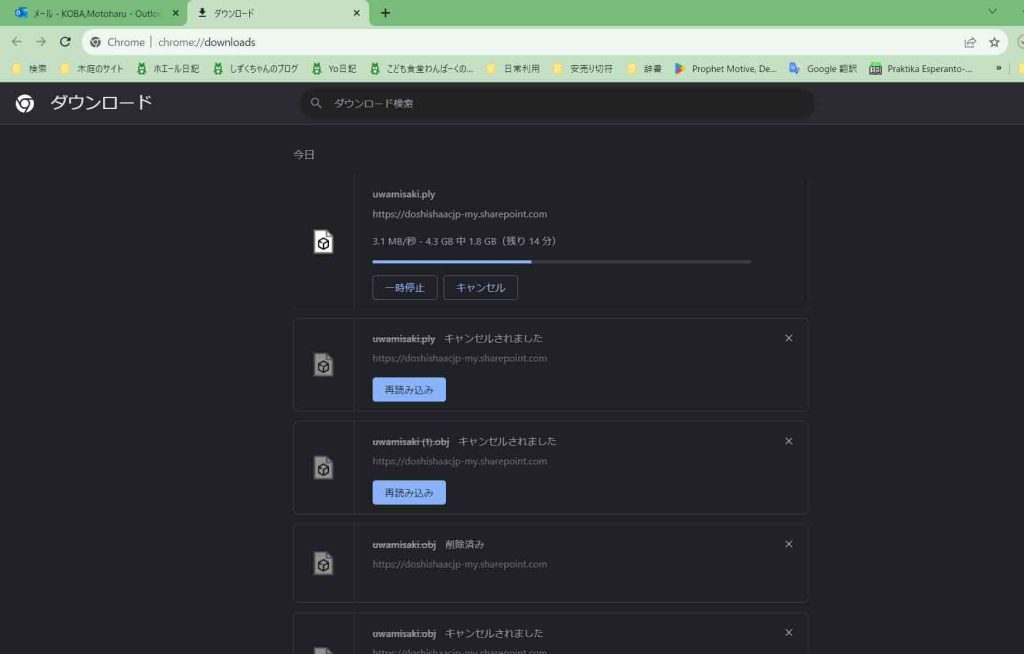
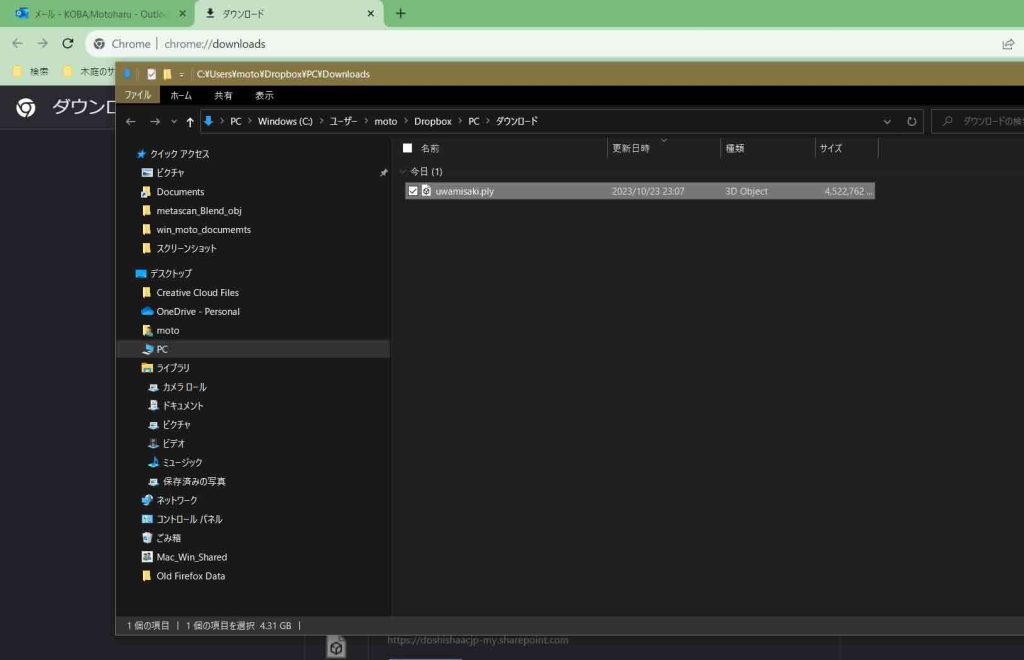
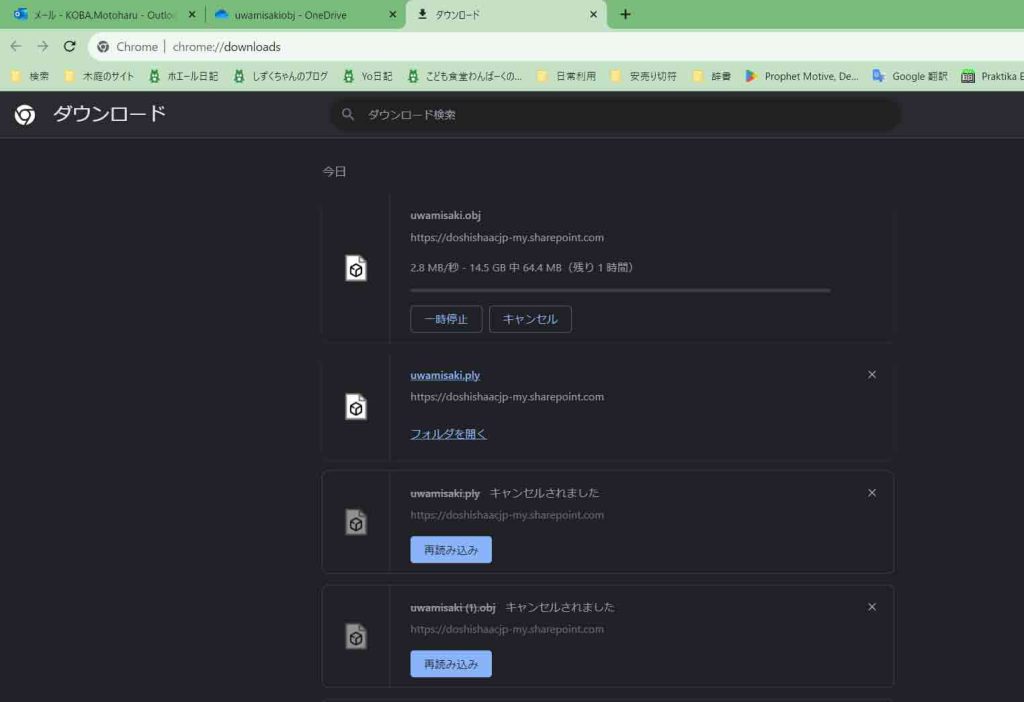
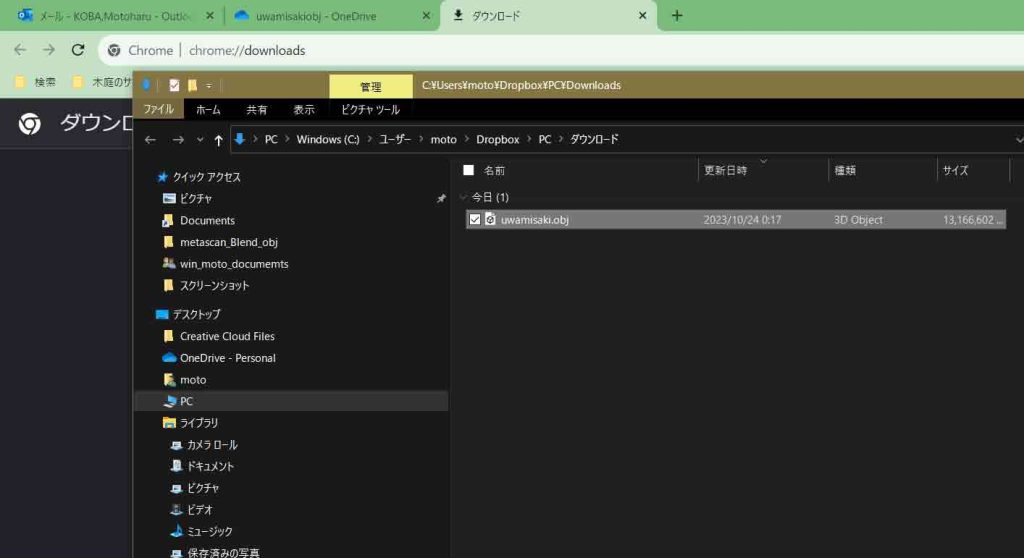
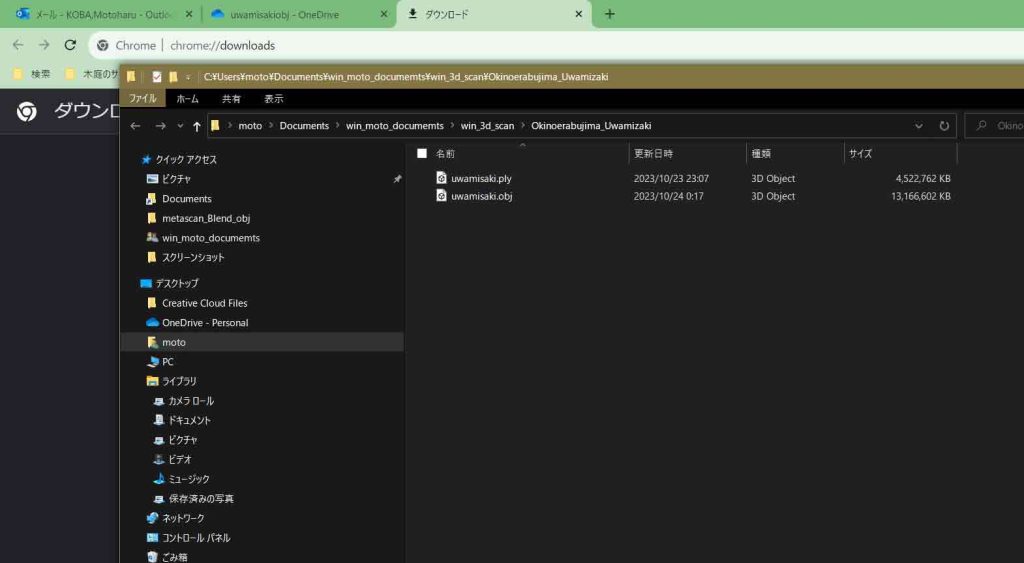
重い3Dファイルの移動とダウンロード forwarding or downloading a weighty 3D file
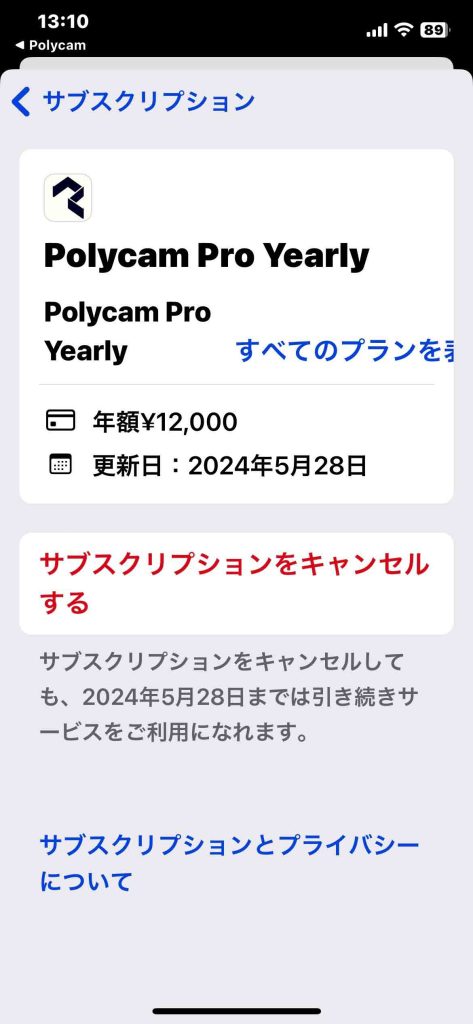
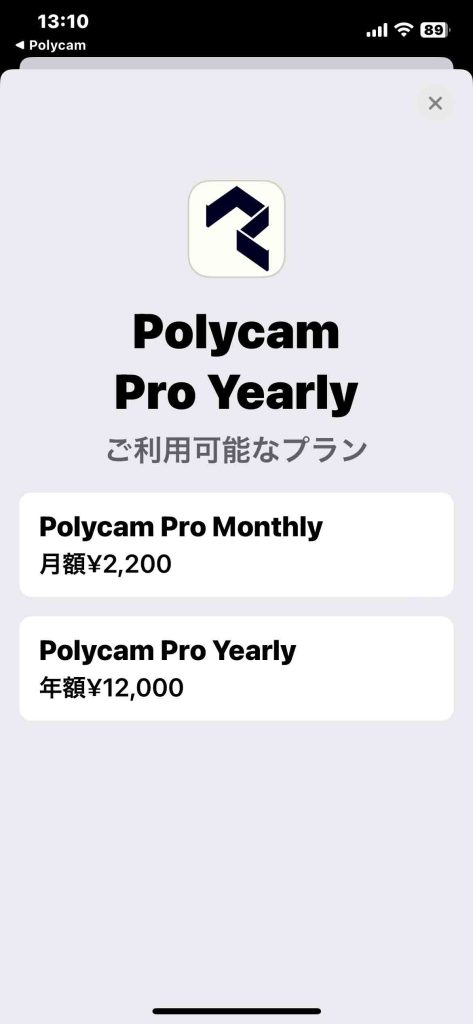
月単位で考えると,$15だから,15 x 138/$ = 2070円だ。調査の際に,月単位で利用するのがいい。 Academic(アカデミックメールアドレス)で申請すると,$80/2 x 150円/$ = 6000円だからこの選択もあるが,今回の試用の結果を評価して,他と比べて断然いい場合は,この選択もある。
図1 Polycam Proの料金
1.2 vGIS Scan これは日本では認知されていない。vGIS Pricingで見ると,vGIS ARは,$1,250 USD per user annuallyだ。しかし,アップルストアからダウンロードできるvGIS scanには課金内容が見えない。クラウドの出力の際に請求があるかも知れない。まだ実行していない。ぼくの使用法からすると,vGIS ARは不要だ。ファイル出力の際に請求がきたら使用しないだろう。額によるが。
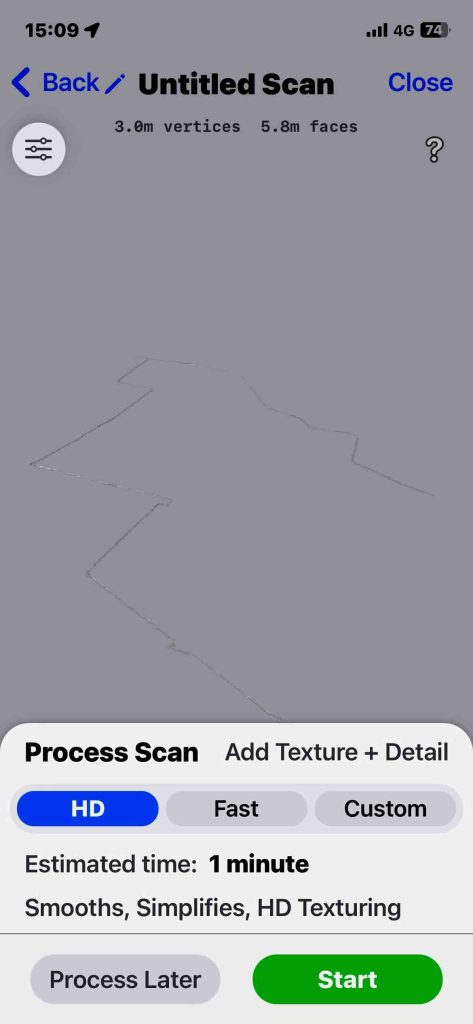
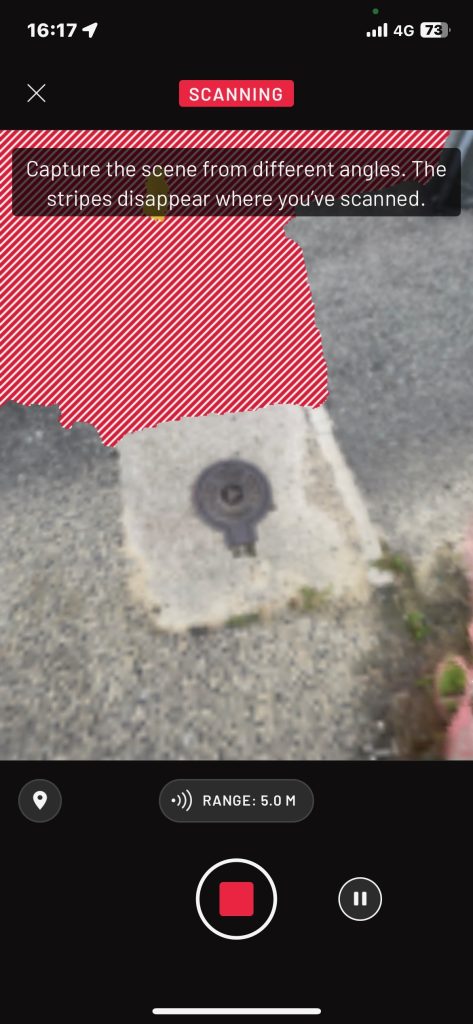
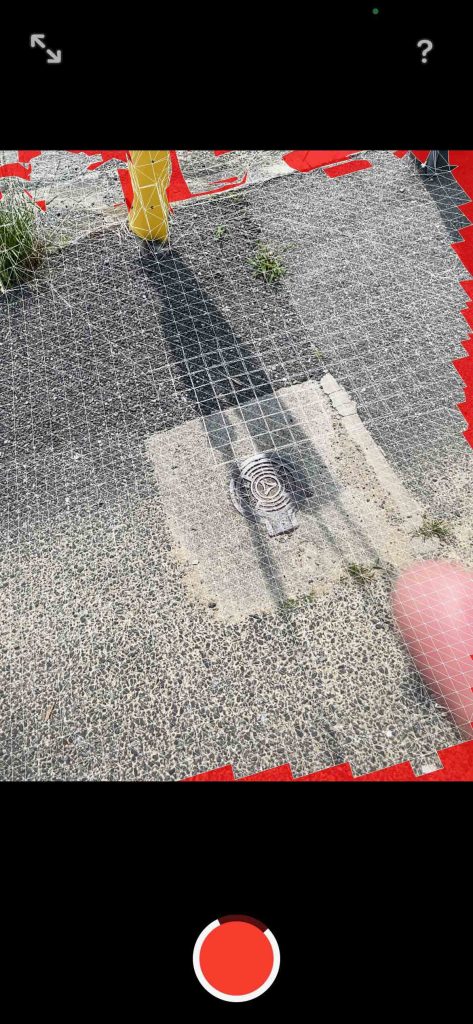
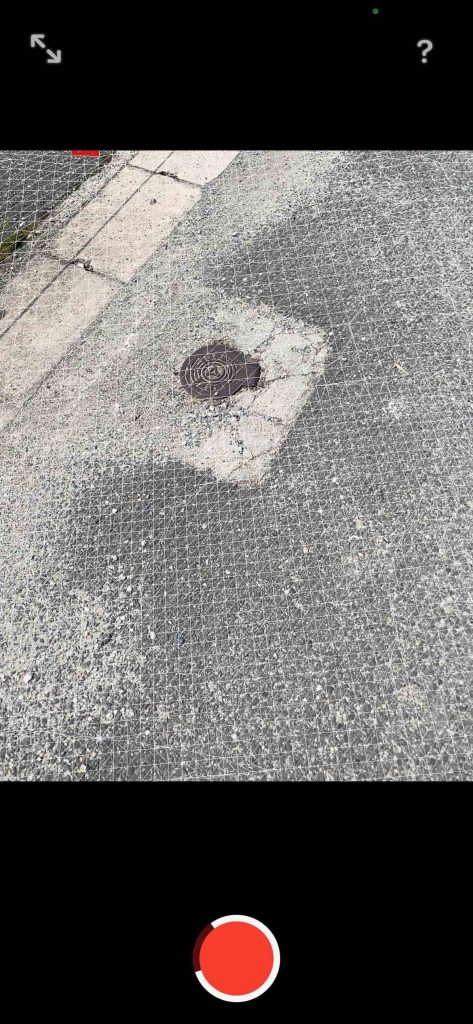
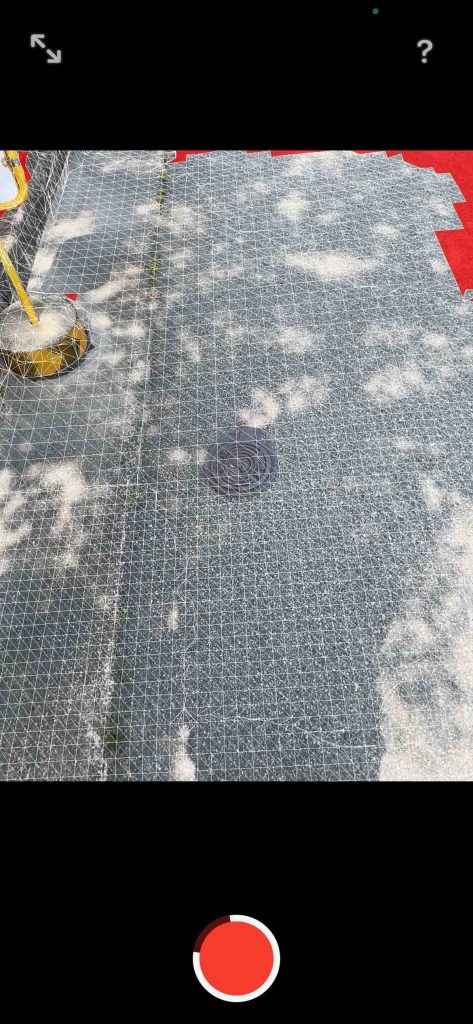
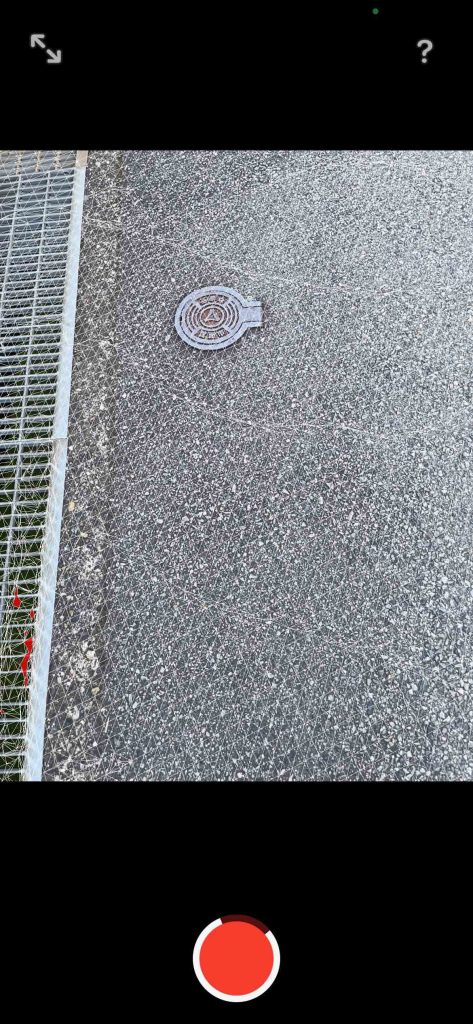
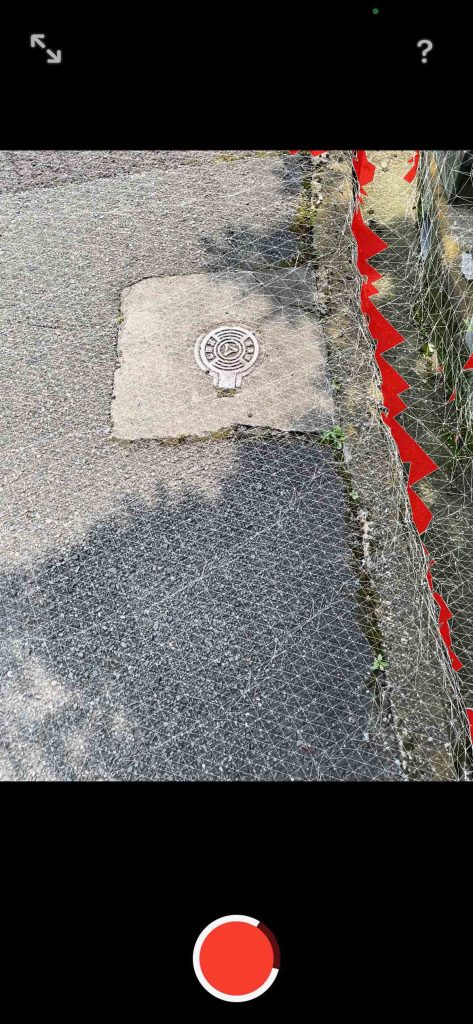
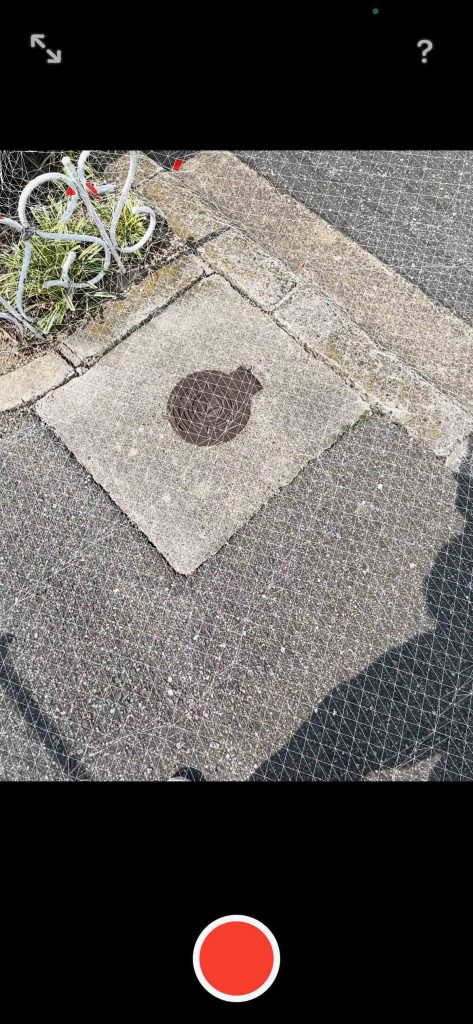
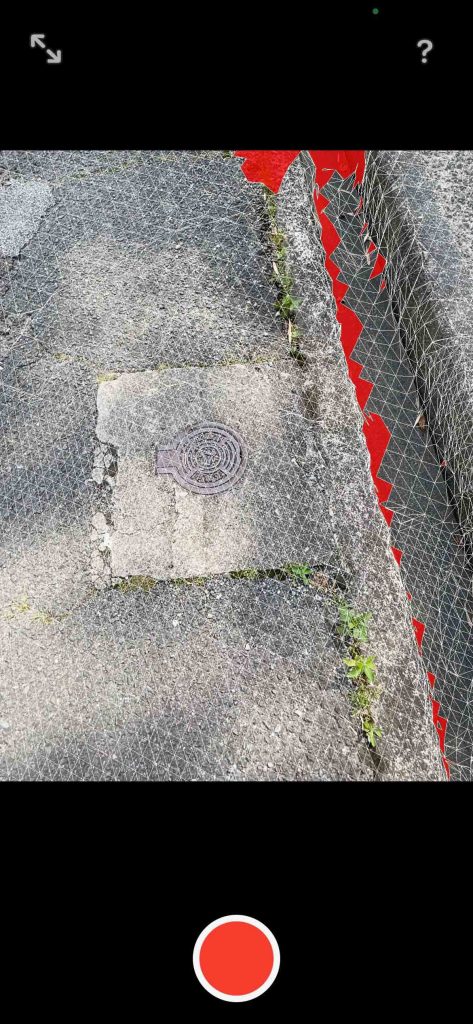
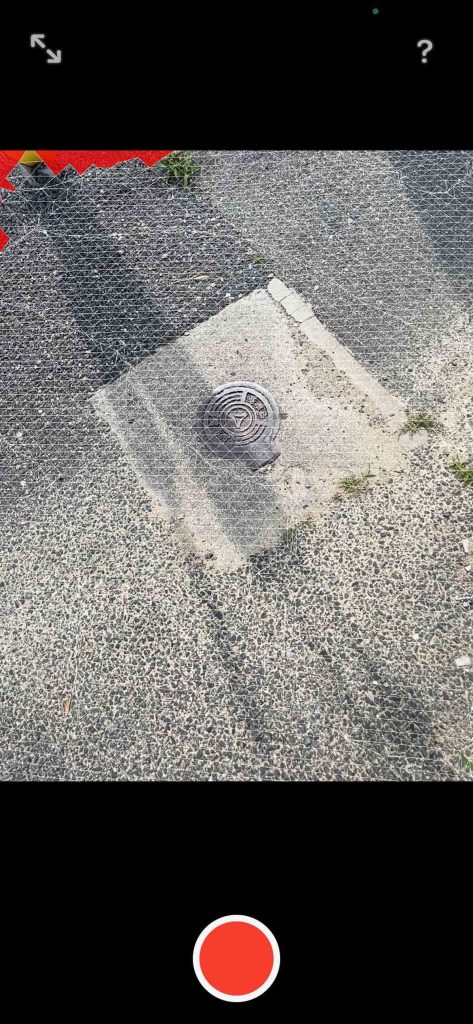
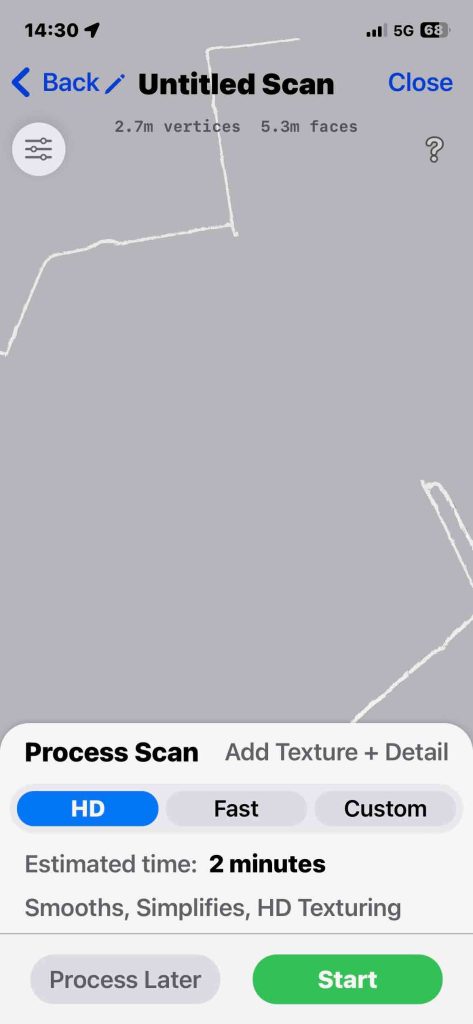
結果は,大いに期待できた。iPhone 12 Pro画面の最下部のレコードボタンを押して,測量は終了すると,図44のような,メニューが表示される。ほぼ2分間でProcessingができるということで,ゴール地点で,実行した。図44を見ると,最下段に,Process Later のボタンもあって,測量が全部終わって,帰宅してからでも,問題はないと思う。この時点で,バッテリー残量は68%であった。出発時にはほぼ100%であったから,30%ほどを消費したことになる。バッテリー充電器は持参していた。もちろん,デフォルトの図44HDのまま,Startボタンを押した。