QgisとGrassGISの何れが3Dメッシュと点群ファイルを生かすことができるか which is better Qgis or GrassGIS for the display and analization of 3D mesh and cloud data ?

Contents
1. 期待していること
GrassGISをかつては使ってきたがご無沙汰している。Qgisは1回だけ使って精度面で問題を多く感じてアプリも削除した。Qgisは大衆化が著しく,悪貨が良貨を駆逐する,勢いである。日本の行政はGrassGISを飛び越して,専らQGIS派である。行政のコンテンツがQgisを意識したものになっている。
さて,3Dメッシュまたは点群ファイルへの対応はどうだろうか。もちろん,GrassGISではこのアプリ公開以来,早くから米軍やNASAのLiDARデータの処理が実行されてきたのであるが,ぼくはこのコンテンツには触れなかった。
いま,求めるのは,3Dモデルの3D表示能力はもちろんである。CloudCompareはその点では問題はない。しかし,CloudCompareでは,3Dモデルに,他のベクトルデータをオーバーレイすることができない。これはかなり不便なことである。それで,GISソフトに期待してのこのページ作成である。
繰り返すと,3Dモデル表示が自在で,他のベクトルデータをオーバーレイできるか。この観点で,両アプリを調べたいと思う。
2. GrassGISではどうか
2.1 ケース1
まずは次の回答を紹介する。
Import Point-Cloud to Grass-Gis
Data Processing – Discussion and Q&A
Got it. I know Lidartools (which LAStools is dependent on) was not ported for QGIS 3 so that what I was getting at. 10M points isn’t all that big so if you have at least 16GB of RAM you shouldn’t have any problems, but considering you are having problems with a 500 point subset then we know that combined with the scaling issue that it’s probably not your plug-ins. Have you tried downloading and importing an XYZ version?
You might try PDAL.
https://grass.osgeo.org/grass78/manuals/v.in.pdal.html 23
QGIS 3では対応できない。GLASSではXYZ形式であれば扱えるのではということである。RGB情報を破棄してしまうのは余りに不便でGLASSでも使い物にならないということだ。
2.2 r.in.pdal – Creates a raster map from LAS LiDAR points using univariate statistics
このタイトルのリンクは,GLASSのマニュアルページである。
The r.in.pdal module loads PDAL library supported point clouds (with emphasis on LiDAR LAS files) into a new raster map using binning. The user may choose from a variety of statistical methods which will be used for binning when creating the new raster.
と,あって,精度が落ちるという点で,この種の処理をぼくは求めていないので,脚下だ。なお,ここでのテーマはLiDAR測量の生データの処理であり,いま,agisoftで,plyファイルなどが手に入るので,このケース1は求めるものではない。
2.3 ケース2
それでは,まずは,plyファイルをGrassGISが取り込めるかについて調べてみる。
v.in.ply – Creates a vector map from a PLY file.
v.in.ply imports a vector map in PLY vector format. A PLY file always holds a number of vertices which are imported as points. PLY vertices can have a number of properties in addition to their coordinates. These properties are stored in an attribute table. For larger PLY files with many vertices (> 1000) it is highly recommended to not use DBF as database driver, but SQLite (default in GRASS GIS 7), PostgreSQL or MySQL, because the DBF driver is rather slow and can consume a lot of memory. The database driver can be set with db.connect.
v.in.ply is designed for large point clouds with the possibility to have only coordinates, and no attribute table (for speed reasons).
と,あって,興味深いことを次に。
GISデータの基本コンテンツと考えていたDBFが,GrassGIS7以降,デフォルトとして,使われていないことである。SQLite (default in GRASS GIS 7)。これには驚いた。ぼくは時代遅れになっていた。
上記Descriptionを見て大変期待できると思ったが,上記Notesを見ると,only coordinates, and no attribute table (for speed reasons),とあって,ショックではあった。PLYファイルからRGB情報が削除されるのである。
こう考えると,3D表示の可能性も見えないし,GISを使うメリットが感じられなくなったのである。
v.ply.rectify – Imports PLY points, georeferences and exports them. も重要だ。
v.ply.rectify imports a PLY point cloud, georeferences and exports it. The first three vertex properties must be the x, y, z coordinates with property names “x”, “y”, “z”, in this order.
A text file with Ground Control Points (GCPs) must exist in the same folder where the point cloud is located, and the textfile must have the same name like the point cloud, but ending on .txt instead of .ply.
The text file with GCPs must have the following format with one GCP per line: x y z east north height status with x, y, z as source coordinates and east, north, height as target coordinates. The status indicates whether to use a GCP (status is not zero) or not (status is zero). Entries must be separated by whitespace or tabs. Decimal delimiters must be points.
The georecitifictation method used is a 3D orthogonal rectification where angles are preserved. 3D objects are shifted, scaled and rotated, but no shear is introduced. Please read the output of the module, in particular the root mean square (RMS) errors.
v.ply.rectify optionally exports the georeferenced point cloud not only with real coordinates, but also with shifted coordinates (-s flag) for display in meshlab or similar software that can not deal with real coordinates. The exported PLY point clouds will be in the same folder like the input PLY point cloud.
次の観点は重要である: x y z east north height status with x, y, z as source coordinates and east, north, height as target coordinates。通常のGISの座標系と異なり,x,y,z=easting, northing, heightになっている。別氏によればメタシェープでの処理も同様のようだ。
3. Qgisではどうか
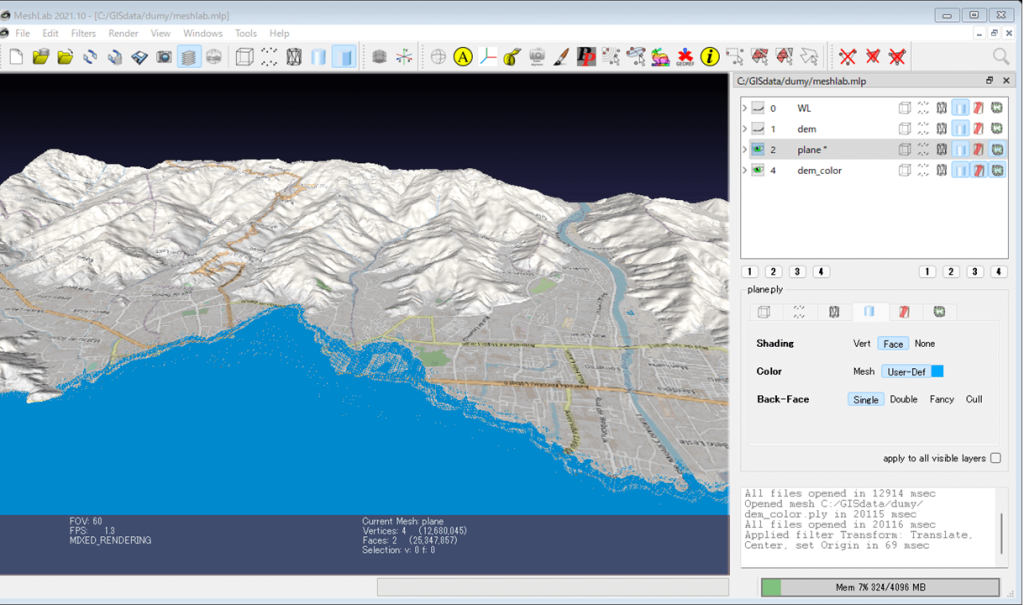
QGISで色付きの3Dメッシュを作成する は参考になったが,かなり,面倒な過程を経ている。わざわざ,他のカラー付きの画像を利用するのも理解できない。ここでは結局のところ,MeshLabが使われている。Qgisには3D表示能力がないようだ。この図1の右手のペーンには,レイヤーが配置されている。複数の3Dレイヤーを重ねて表示できるのである。不勉強でこの基礎的な機能についてさえ,知らなかった。
Blenderでも可能である。Blenderで点群(.ply)を色付きでレンダリングする Sep.23, 2023
出来上がった3Dオブジェクトを見ると,いかにも寂しい。
で,SKラボ.netの,QGISで色付きの3Dメッシュを作成する,に出会った,と思った。しかし,元々RGB情報を持つplyを直接使わないのか,わからない。plyをインポートする際にRGB情報を廃棄してしまうからではあるが。結局,ぼくには無用のものであった。
4. MeshLabで
結局,GLASSもQgisも使えないことがわかった。MeshLabに期待したい。MeshLabの操作法を学んで,このページに示したいと思う。
以上,19:15,2024/01/06記。
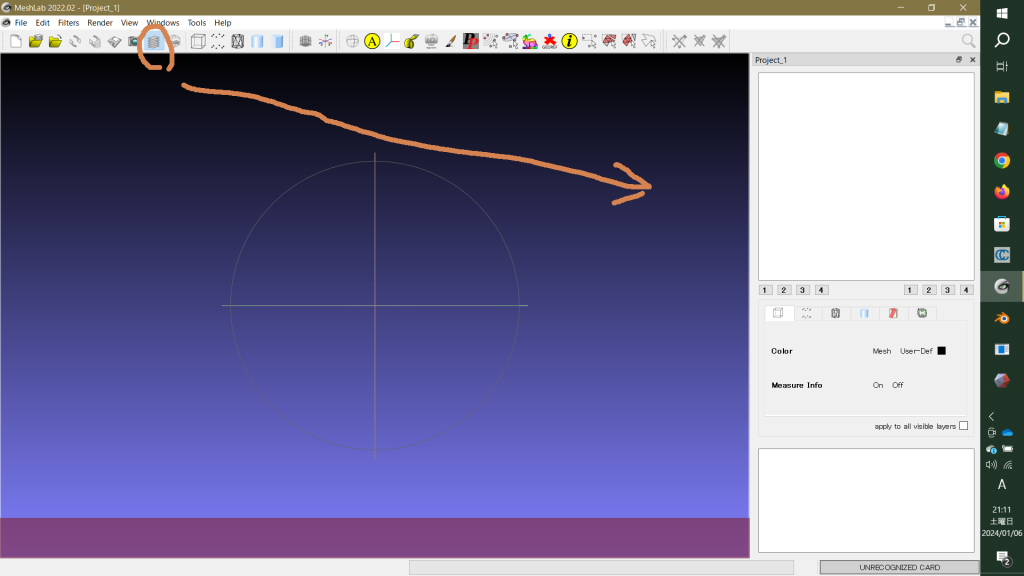
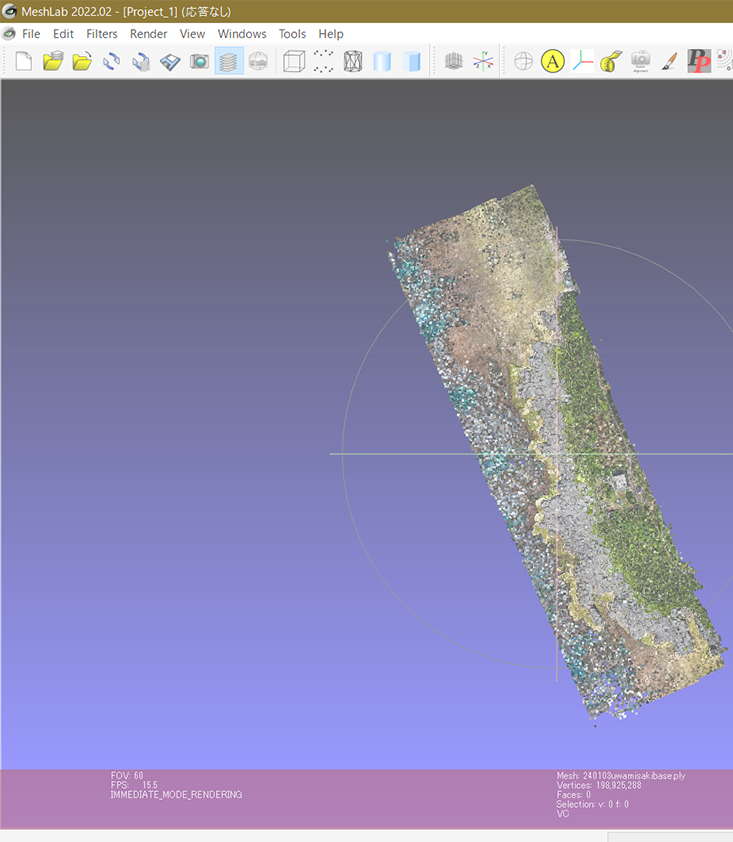
図2のように,layer dialog boxを開いて,240103uawmisakibase.plyを
File > Import Mesh,で呼び出した。2分ほど。All files opened in 102,894 msecと表示されている。vertices: 198,925, 288だ。約2億個。
Filters/Sampling/Clustered Vertex Subsampling, で,Cell Size1.0を例えば0.3などに変更してApplyしようとしたが,メーンメニューのFiltersをタップするだけで,応答無し,でフリーズしてしまう。重すぎるのだ。
仕方無く,CloudCompareでFiles > Openを実行した。
5. CloudCompareでdown-samplingを
試行錯誤してやっと見つけた。すごく簡単ではあった。Edit > subsample を実行すれば良い。開いたパネルで,min space btw points =,入力する数値であるが,2.7mにすると,出来上がったオブジェクトは7073点でスカスカだった。0.01mにすると全く変化なし。同じだ。で,0.100(10cm)にすると(図4は実行開始時, 図5は完成後),3,135,591点で,適当であった。元々2億点(198,925,288)からかなりスマートになった。
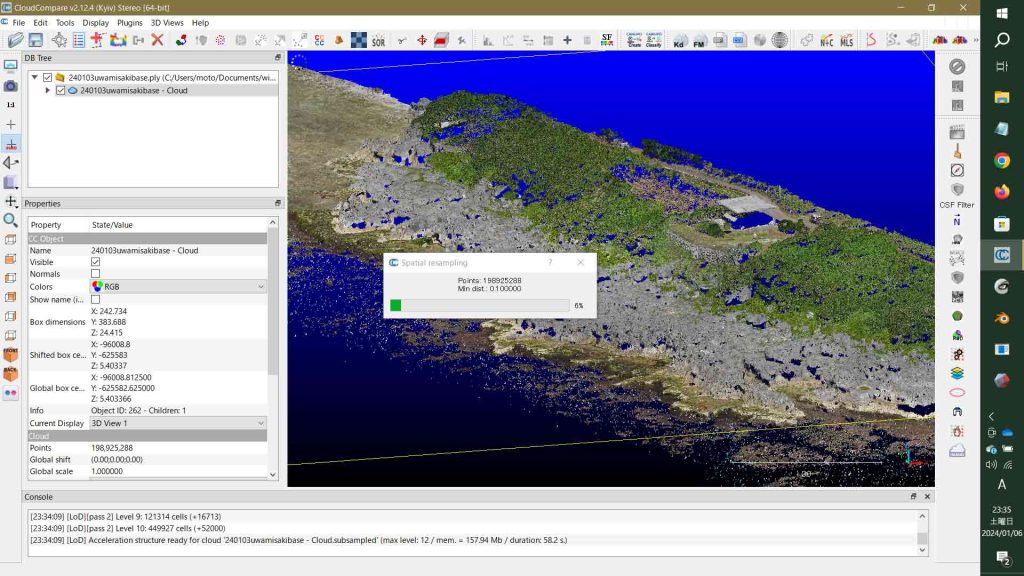
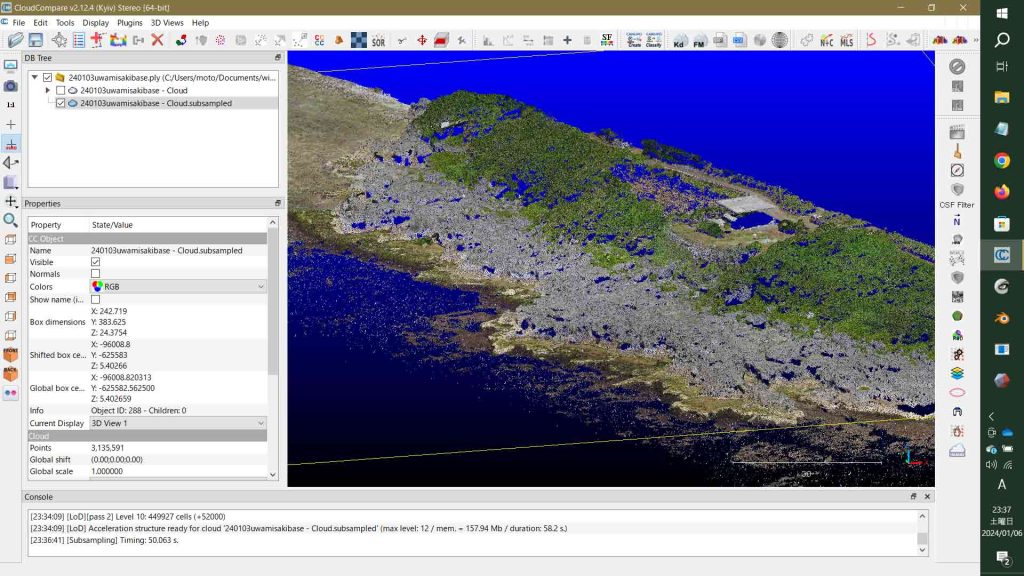
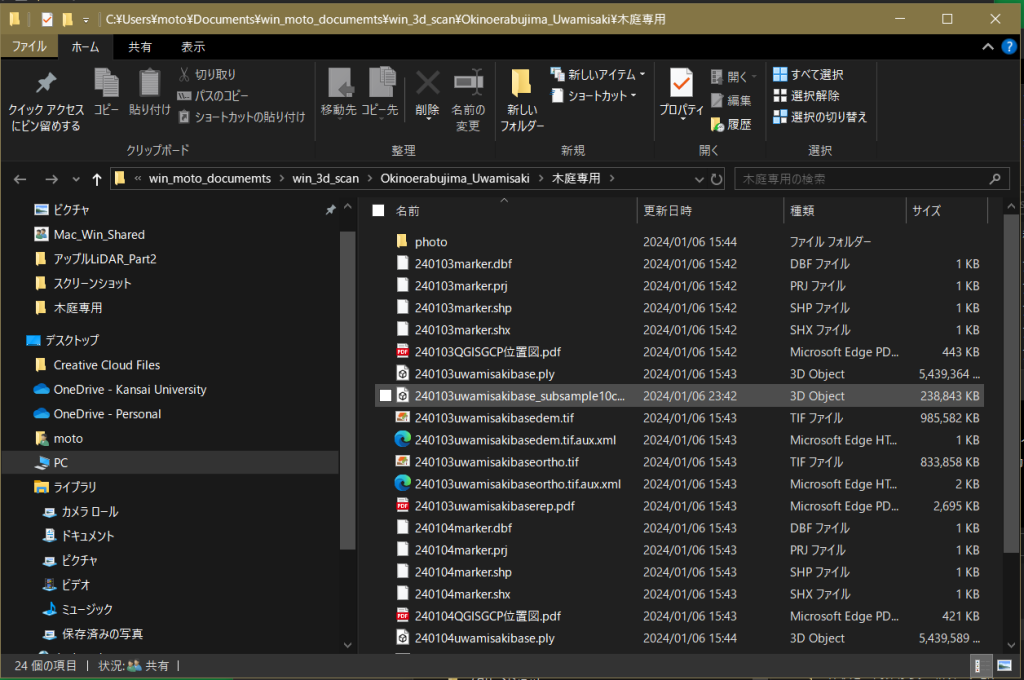
図6には保存した新たなPLYファイルが見えていて,5GBから238MBへとよほど軽くなっている。
では,MeshLabへ,という流れになるはずではあったが,偶然,Danielの凄いアドバイスを見つけてしまった。
Create a new layer of just ground points (already classified) である。
以上,0:15,2024/01/07記。
6. CloudCompareでgcpも表示することに
上記の,Create a new layer of just ground points (already classified) ,の内容を次にコピペする。
Create a new layer of just ground points (already classified)
Joined: Tue Aug 09, 2022 10:34 am
Create a new layer of just ground points (already classified)
Post by okay » Tue Aug 09, 2022 10:36 am
Hi - I’m trying to make a separate layer of just the ground points in my point cloud. In other words, I want to be able to turn on and off a plot of just the ground points. I know about the CSF plug, but this isn’t necessary to use since the point cloud is classified. I can only figure out to how filter by value, but not by classification. Thanks.
Location: Grenoble, France
————————————————
Contact: Contact daniel
Re: Create a new layer of just ground points (already classified)
Post by daniel » Wed Aug 10, 2022 5:56 pm
Maybe you can use the new ‘qCloudLayers’ plugin?
Another way, maybe more simpler, is to use the ‘Edit > Scalar fields > Split cloud (integer values)’ method. This will create as many (sub) clouds as classes present in your cloud.
Daniel, CloudCompare admin
————————————————
CloudCompareの開発者Danielさん,に,感謝。
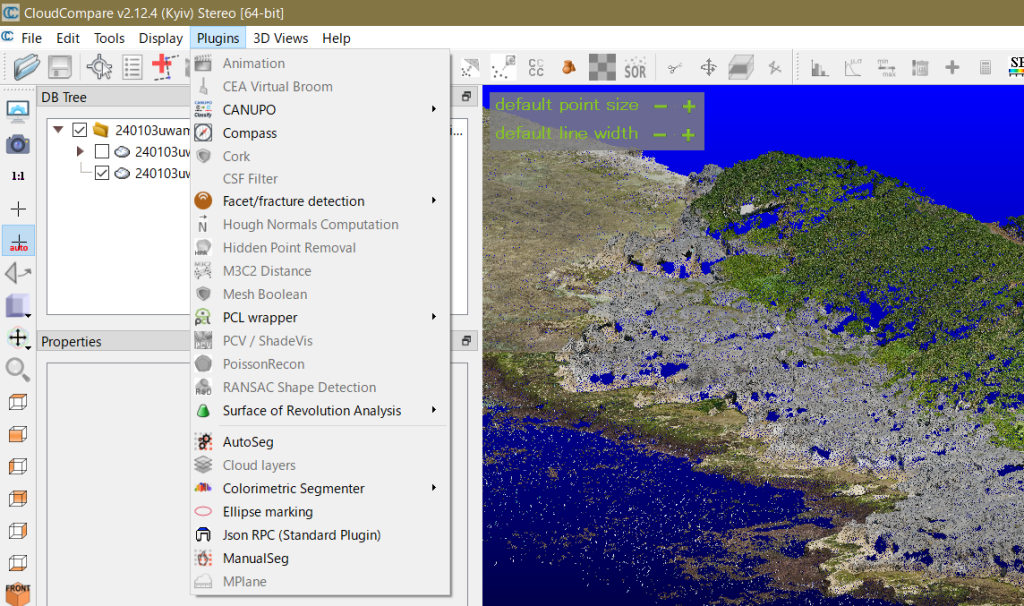
この情報を契機に,CloudCompareのPlugins Cloud layers,の存在を知った。図7のように,いま,使用中のCloudCompareの最上部には,CloudCompare v.2.12.4 (Kyiv) Stereo [64-bit],が表示されている。メーンメニューPluginsに見えるCloud layersが欲しいのだが,灰色だ。
このページのテーマが遷ってきているので,別にページを立てることにする。後に,そのページのリンクを示す。
以上,13:28,2024/01/07記。